Why Candlestick Charts Are Essential for Beginners
If you’re new to trading, candlestick charts are one of the most important tools you should learn first. Whether you’re trading stocks, forex, or cryptocurrency, candlestick charts help you see what the market is doing—clearly and quickly. In this beginner-friendly guide, you’ll learn why candlestick charts are essential, how they work, and how they improve your trading decisions.
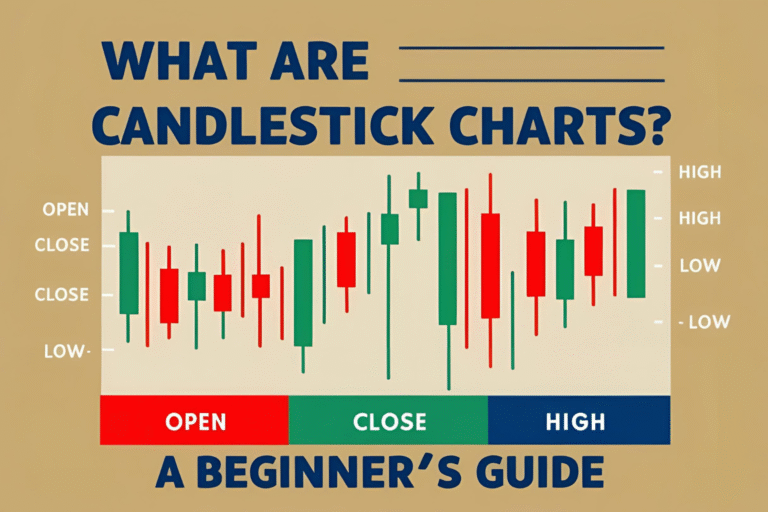
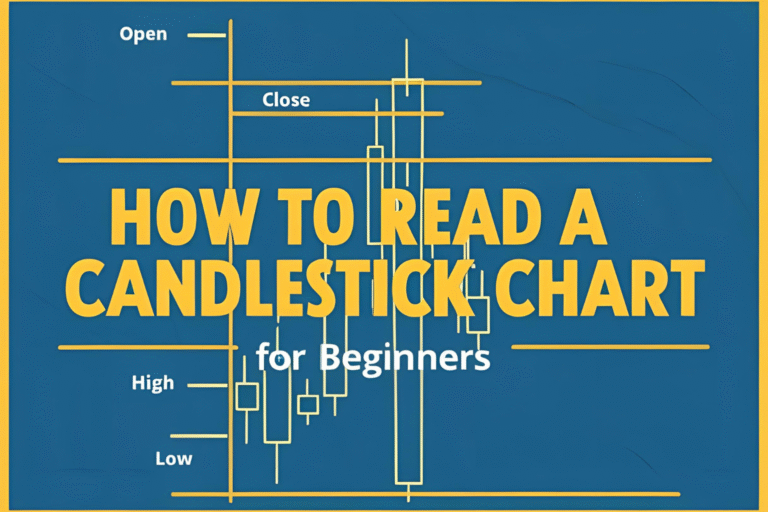
What Are Candlestick Charts?
Candlestick charts visually represent price movements over a selected period. Each candle shows:
- Open price
- Close price
- High
- Low
This four-point structure makes them far more informative than traditional line charts. Plus, candlestick charts are easy to read, making them perfect for beginners.
1. They Visualize Market Sentiment Instantly
Unlike line or bar charts, candlesticks give immediate insight into:
- Who’s in control (buyers or sellers)
- Market strength and momentum
- Potential reversals or continuation patterns
A green (bullish) candle means price closed higher than it opened. A red (bearish) candle means the opposite.
Example: A long green candle = strong buyer control
A doji = market indecision
2. Candlestick Patterns Help Spot Reversals Early
Patterns like:
- Hammer
- Bullish Engulfing
- Morning Star
…can signal a reversal before it fully plays out. For beginners, this means you can enter early and avoid trading in the wrong direction.
3. They Work Across All Markets and Timeframes
Candlestick charts are universal. Whether you’re trading:
- Stocks like Apple or Tesla
- Forex pairs like EUR/USD
- Cryptos like Bitcoin or Ethereum
…candlestick patterns work the same way. They’re also effective on any timeframe—1-minute to daily, weekly, or monthly charts.
4. They Make Technical Analysis Easier
For a beginner, technical analysis can feel overwhelming. Candlestick charts simplify the process by:
- Making price action visual and intuitive
- Highlighting clear patterns and zones
- Reducing reliance on complex indicators
With just a few basic patterns, beginners can build solid trade setups.
5. They Improve Timing for Entry and Exit
Many traders struggle with when to enter or exit trades. Candlestick charts help by:
- Showing clear breakout or reversal points
- Helping set stop-losses just beyond candle wicks
- Offering visual confirmation before acting
This leads to better risk management and decision-making.
6. They Combine Well with Other Tools
Candlestick charts work best when paired with:
- Support and resistance zones
- Trendlines
- Moving averages
- Indicators like RSI or MACD
This makes them a core part of nearly every trading strategy—from beginner to advanced.
FAQs
Why should beginners learn candlestick charts first?
Because they provide clear, visual insights into market behavior and are easier to learn than complex indicators.
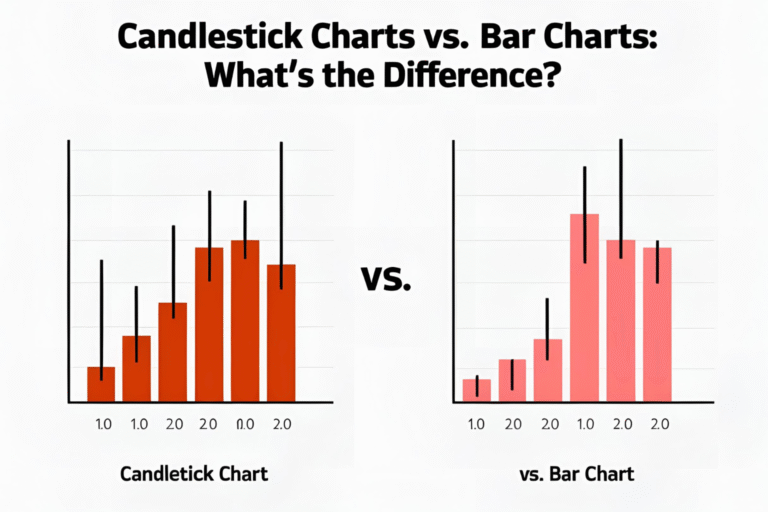
Are candlestick charts better than line charts?
Yes. Line charts only show closing prices, while candlestick charts give you more context with open, close, high, and low.
Can candlestick charts be used in crypto trading?
Absolutely. They work across all markets including stocks, forex, and crypto.
Do I need special software to use candlestick charts?
No. Most free platforms like TradingView, MetaTrader, and Binance support candlestick charts.
How long does it take to get comfortable with candlestick charts?
Most beginners become confident with daily practice in 2–4 weeks.