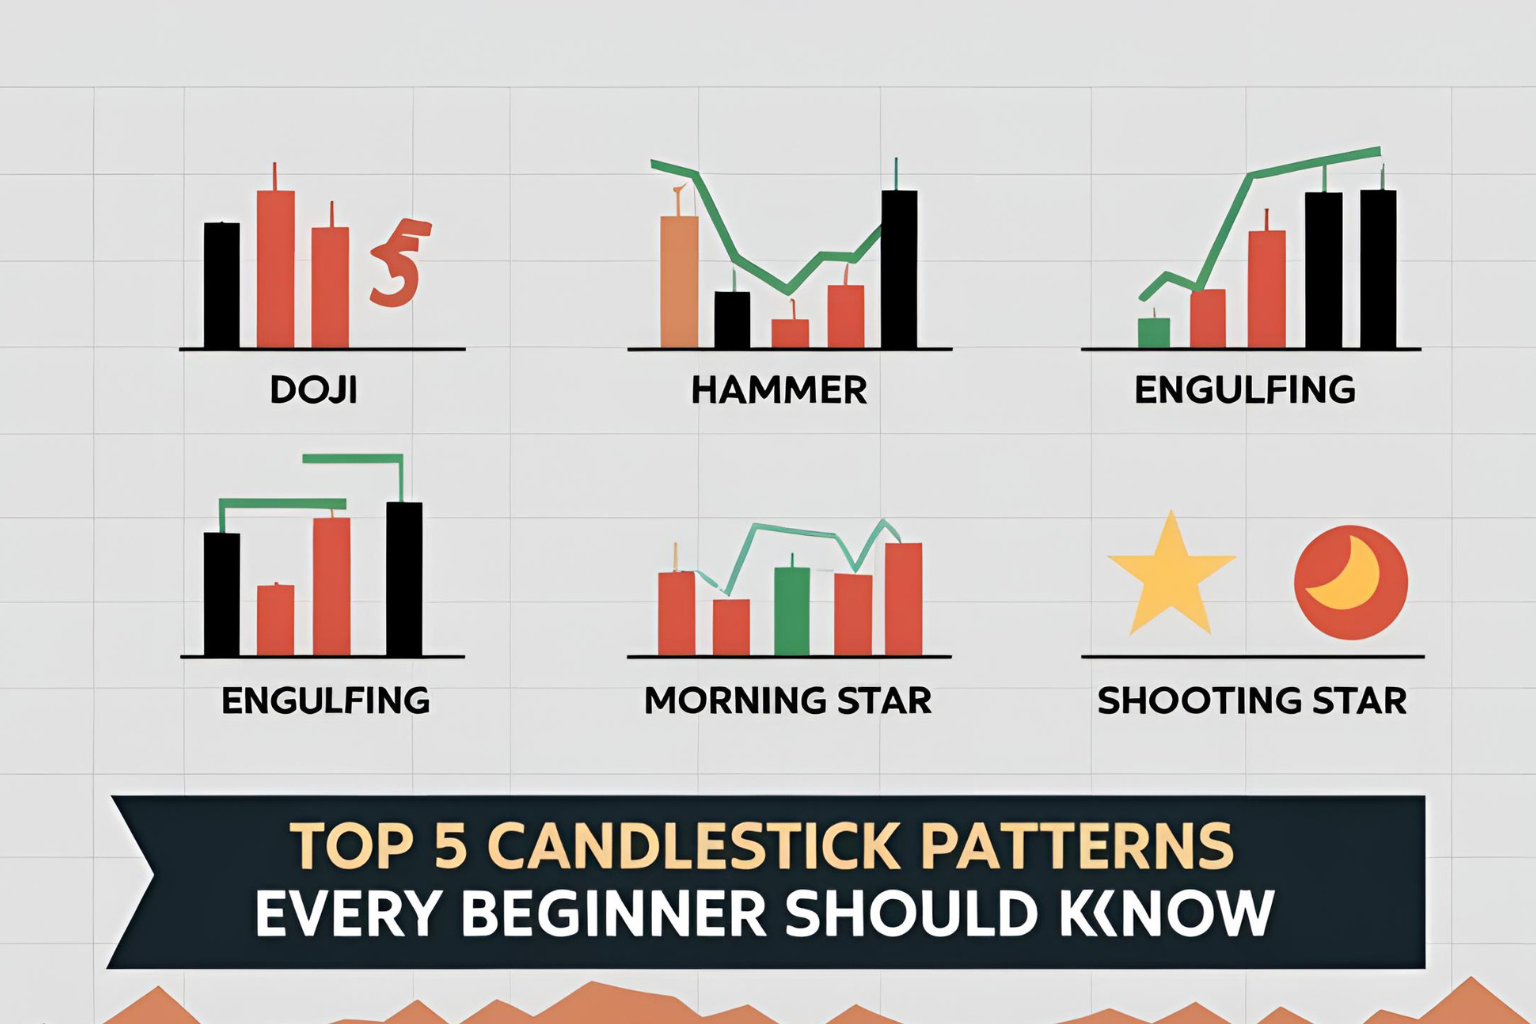
Top 5 Candlestick Patterns Every Beginner Should Know
Learning to read candlestick patterns is one of the most important skills for any new trader. These visual signals can help you recognize potential price reversals, trend continuations, and key market turning points. In this guide, we’ll break down the top 5 candlestick patterns that every beginner should know—whether you’re trading stocks, forex, or crypto.
Each of these patterns is easy to identify and works well on various timeframes, especially when confirmed by support/resistance or other indicators.
1. Hammer
Type: Bullish Reversal
Best Used: After a downtrend
A hammer has:
- A small real body at the top of the candle
- A long lower wick (at least 2x the body)
- Little to no upper wick
It signals that sellers pushed the price down, but buyers regained control before the candle closed.
Trading Tip: Look for a hammer at key support levels and confirm with volume or trendline breakouts.
2. Shooting Star
Type: Bearish Reversal
Best Used: After an uptrend
The opposite of a hammer:
- Small real body at the bottom
- Long upper wick
- Little to no lower wick
It shows that buyers tried to push prices higher, but sellers took over by the close.
Trading Tip: Combine with resistance levels or RSI overbought conditions for stronger confirmation.
3. Bullish Engulfing
Type: Bullish Reversal
Best Used: After a downtrend
This two-candle pattern features:
- A small red (bearish) candle followed by
- A large green (bullish) candle that completely engulfs the previous candle’s body
It signals a shift in momentum from sellers to buyers.
Trading Tip: A bullish engulfing pattern near support often marks a potential trend change.
4. Bearish Engulfing
Type: Bearish Reversal
Best Used: After an uptrend
The inverse of bullish engulfing:
- A small green candle followed by
- A large red candle that engulfs the green candle’s body
This shows strong seller momentum and potential downside.
Trading Tip: Use with resistance or volume spikes for added reliability.
5. Doji
Type: Indecision or Reversal
Best Used: At tops or bottoms
A doji forms when the open and close prices are nearly equal, resulting in:
- A very small or non-existent body
- Upper and lower wicks of varying length
Doji patterns suggest a pause in the current trend and can lead to reversals, especially when paired with other signals.
Trading Tip: Avoid trading doji alone—always confirm with the next candle or an indicator.
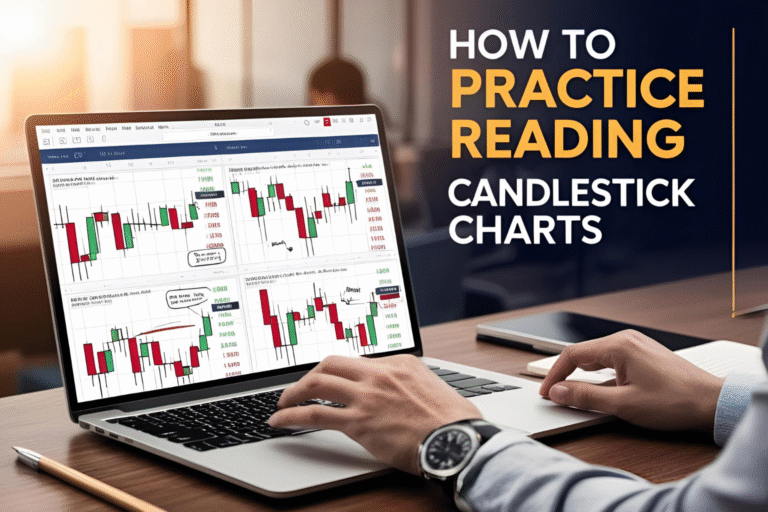
How to Practice Spotting These Patterns
- Use free platforms like TradingView to mark historical examples
- Focus on daily or 4-hour charts for cleaner signals
- Combine candlestick patterns with support/resistance, moving averages, or RSI for better results
- Start with a demo account to build pattern recognition skills
FAQs
Are these candlestick patterns reliable for beginners?
Yes, especially when combined with other tools like trendlines or support/resistance zones.
Which pattern is best for spotting reversals?
Bullish and bearish engulfing patterns are among the most reliable for spotting reversals.
Do these patterns work across all markets?
Yes, these patterns work well in stocks, forex, and cryptocurrency markets.
What’s the best timeframe to use these patterns?
For beginners, the 4-hour and daily charts provide clear, reliable signals.
Can I trade using candlestick patterns alone?
You can, but it’s best to confirm with other signals or tools to increase your success rate.