How to Read a Candlestick Chart for Beginners
Candlestick charts might look confusing at first, but they’re one of the easiest tools for beginners to understand price movements in trading. Whether you’re interested in stocks, forex, or crypto, this guide will walk you through how to read a candlestick chart step by step. Let’s break it down!
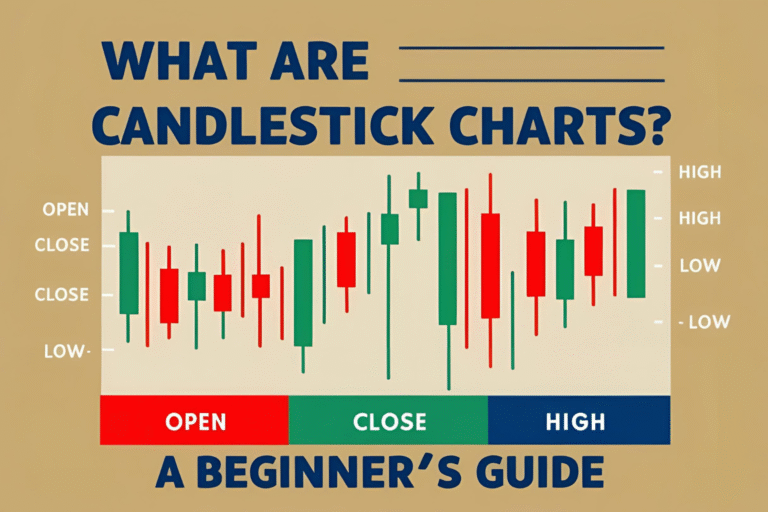
What Does a Candlestick Chart Show?
A candlestick chart displays price movements over a specific time period, like a day or an hour. Each candlestick tells you four things:
- Open Price: Where the price started.
- Close Price: Where the price ended.
- High Price: The highest point reached.
- Low Price: The lowest point reached.
By looking at these, you can see how the price moved and whether buyers or sellers were in control.
Step-by-Step: How to Read a Candlestick Chart
Here’s a simple guide to get you started:
1. Identify the Candlestick’s Body
The body is the thick part of the candlestick, showing the range between the open and close prices. A green (bullish) body means the price closed higher than it opened. A red (bearish) body means the opposite.
2. Check the Wicks
The thin lines above and below the body are called wicks or shadows. They show the high and low prices during the period. Long wicks can indicate volatility or rejection of higher/lower prices.
3. Understand the Timeframe
Each candlestick represents a specific time period. For beginners, start with daily charts (one candlestick = one day) to avoid feeling overwhelmed.
4. Look for Trends
Multiple candlesticks together show trends. A series of green candlesticks suggests an uptrend (prices rising), while red candlesticks indicate a downtrend (prices falling).
Visual: Include a chart with a short uptrend and downtrend. (Alt text: “Candlestick chart trends example”)
Common Candlestick Shapes and What They Mean
Candlesticks come in different shapes, and each tells a story:
- Long Body: Strong buying (green) or selling (red) pressure.
- Short Body: Indecision or low activity in the market.
- Long Wicks: Prices were rejected at highs or lows.
For example, a candlestick with a long upper wick and a small body might mean sellers pushed the price down after it hit a high.
Internal Link: Curious about specific patterns? Read about the Doji Candlestick Pattern for more.
Tips for Beginners Reading Candlestick Charts
- Start Simple: Focus on daily charts to understand the basics.
- Use Free Tools: Platforms like TradingView let you practice reading charts.
- Take Notes: Jot down what you notice about price movements to build confidence.
- Avoid Overthinking: You don’t need to memorize every pattern right away.
Why Reading Candlestick Charts Matters
Learning to read candlestick charts is like learning to read a map. It helps you navigate the market and spot opportunities. As a beginner, this skill will give you a solid foundation for trading stocks, forex, or crypto.
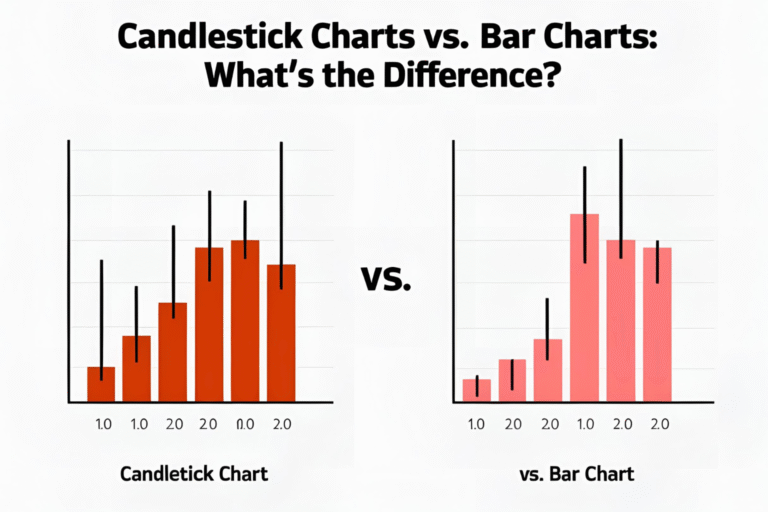
Want to compare chart types? Check out Candlestick Charts vs. Bar Charts.