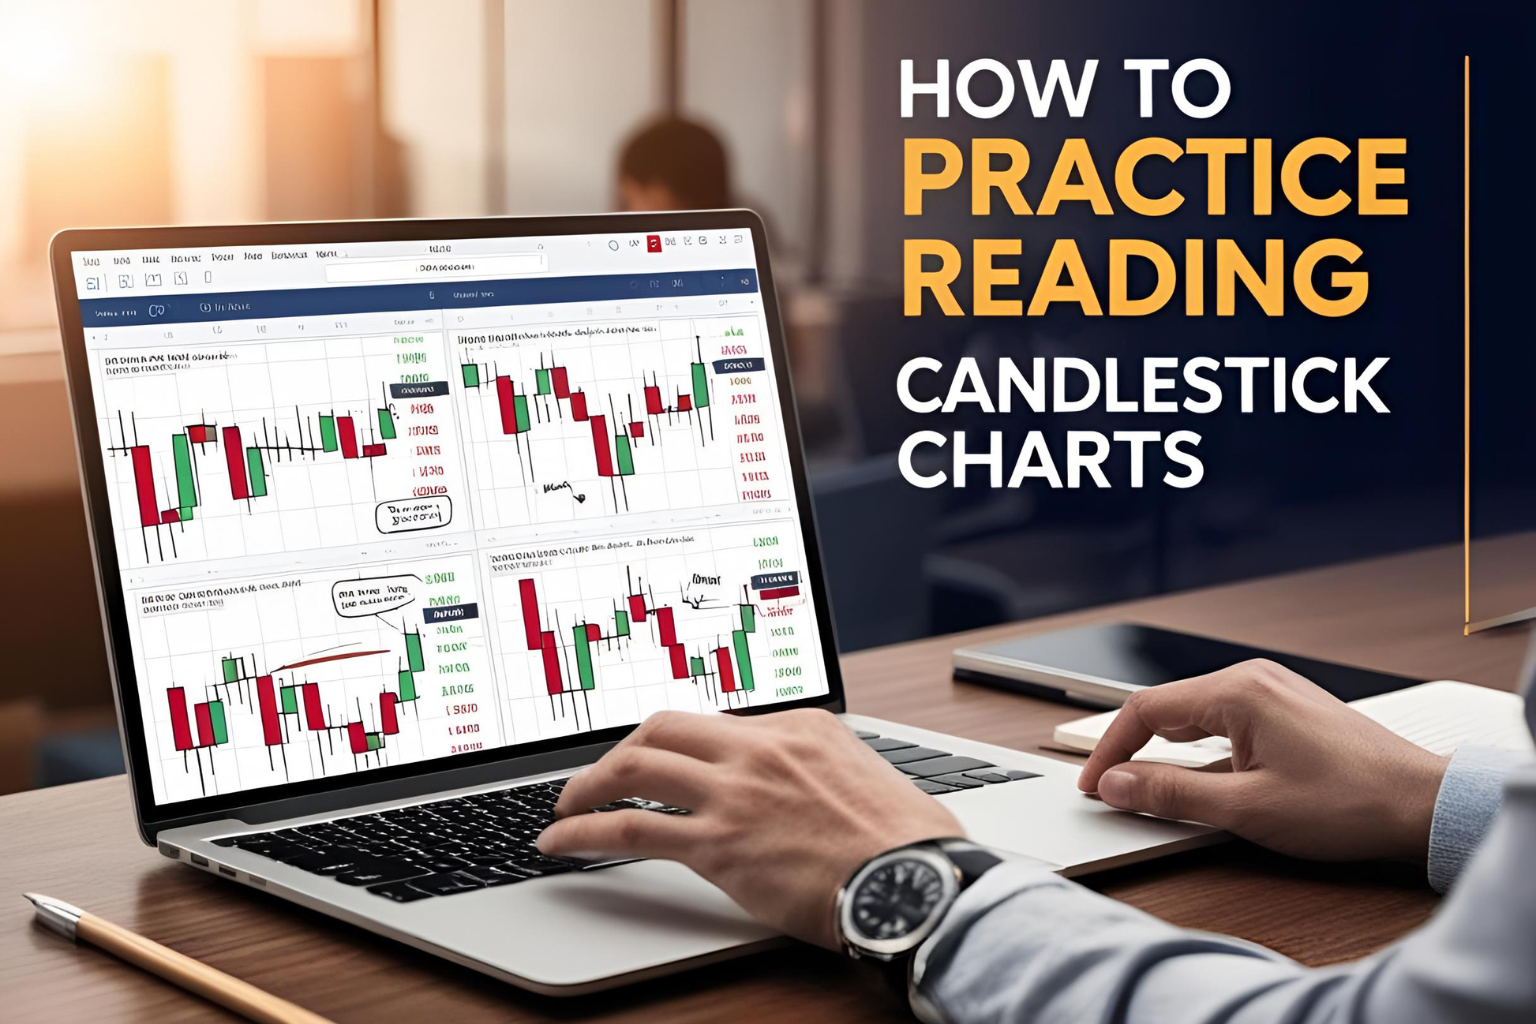
How to Practice Reading Candlestick Charts
Understanding candlestick charts is one thing—reading them with confidence is another. Many beginners struggle to interpret real-time charts, especially in fast-moving markets. The solution? Consistent, structured practice. This guide shows you how to practice reading candlestick charts so you can build strong trading skills step by step.
Why Practice Matters in Candlestick Charting
Candlestick patterns may seem simple in theory, but real charts are filled with noise, fakeouts, and mixed signals. Practicing helps you:
- Build visual recognition of patterns
- Develop pattern confidence under live conditions
- Improve your entry and exit timing
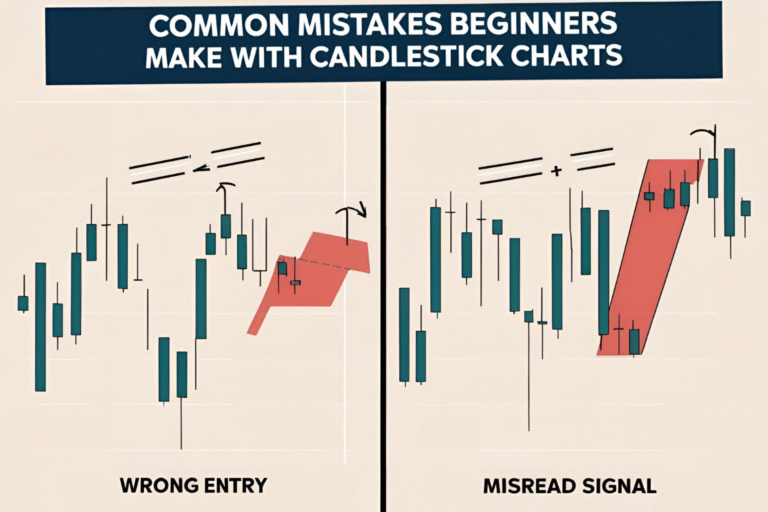
- Avoid common beginner mistakes
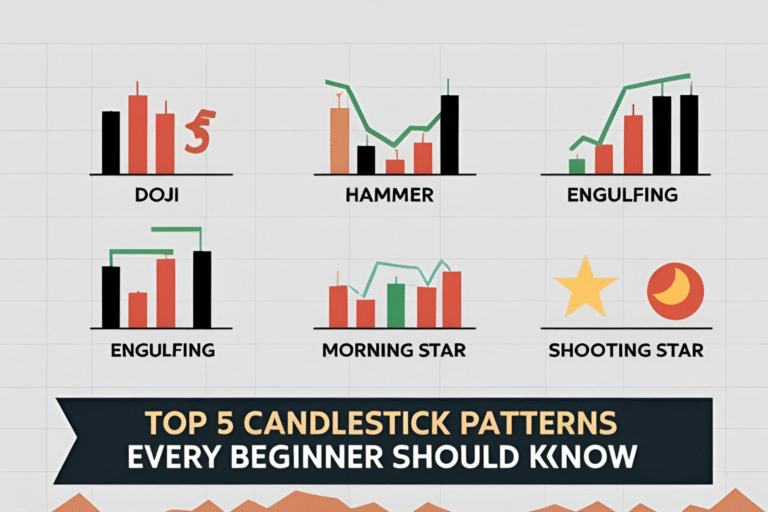
Step 1: Learn the Most Common Patterns
Before you practice on real charts, make sure you can identify key candlestick patterns by name and structure. Start with:
- Hammer
- Bullish/Bearish Engulfing
- Doji
- Shooting Star
- Morning Star / Evening Star
Use educational images or flashcards to memorize them visually.
Step 2: Use Chart Replays on Platforms Like TradingView
TradingView offers a built-in “replay” feature. This lets you:
- Hide future price action
- Move candle by candle
- Predict what may come next
It’s a powerful way to simulate live chart analysis without the pressure of real trades.
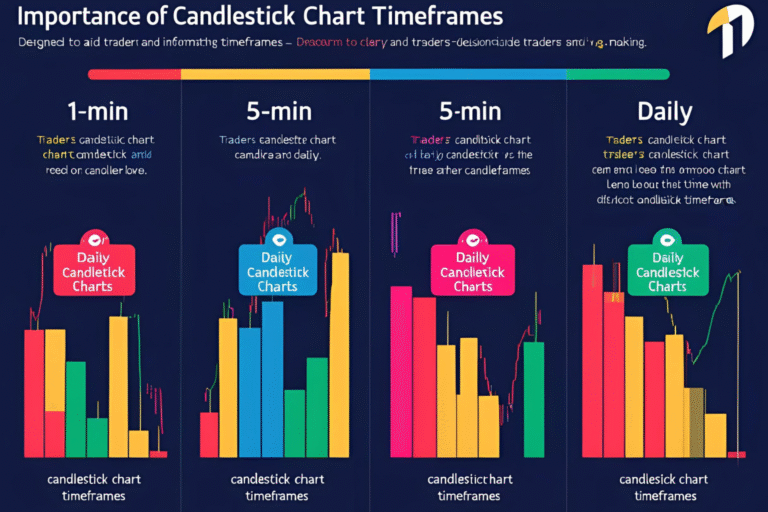
Step 3: Analyze Historical Charts Daily
Pick a trading pair (stock, forex, or crypto), choose a timeframe (like the daily chart), and scroll back in time. Ask yourself:
- What pattern is forming here?
- Is this a good entry or exit?
- Where are support and resistance zones?
Doing this regularly builds pattern recognition and trading logic.
Step 4: Use a Demo Account for Live Practice
Once you’re familiar with patterns and context:
- Open a demo account on platforms like MetaTrader, cTrader, or Binance
- Practice executing trades based on candlestick setups
- Track your entries, stop-losses, and results
This helps you get used to placing real trades without risking money.
Step 5: Keep a Pattern Journal
A trading journal speeds up your learning. Include:
- Screenshot of the chart
- The pattern you saw
- Entry and exit reasoning
- Outcome of the trade (win/loss and why)
Over time, you’ll identify which patterns work best for your style and which setups to avoid.
Step 6: Set a Daily Practice Routine
Even 20–30 minutes per day is enough to build chart-reading skill. Your routine could include:
- Reviewing 3–5 historical charts
- Practicing chart replay
- Journal 1–2 pattern examples
- Reading one short article about candlestick strategies
Pro Tips for Faster Improvement
- Focus on 1–2 patterns at a time
- Don’t rush—look for clear setups
- Practice across different markets (stocks, forex, crypto)
- Revisit past trades and analyze what went right or wrong
- Use support/resistance levels to add context to patterns
FAQs
What is the best way to practice candlestick patterns?
Use chart replays, study historical charts, and trade on demo accounts while tracking your progress in a journal.
How long does it take to get good at reading candlestick charts?
With consistent practice (20–30 minutes a day), most beginners see clear improvement in 2–4 weeks.
Should I use indicators while learning candlesticks?
Keep it simple at first. Once you’re confident, add basic tools like moving averages or RSI for confirmation.
Can I practice candlestick patterns without a trading account?
Yes. Use free tools like TradingView or investing.com to access charts without signing up for a broker.
Do these methods work for crypto and forex too?
Absolutely. The practice techniques are universal across stocks, forex, and crypto markets.