bearish engulfing candlestick

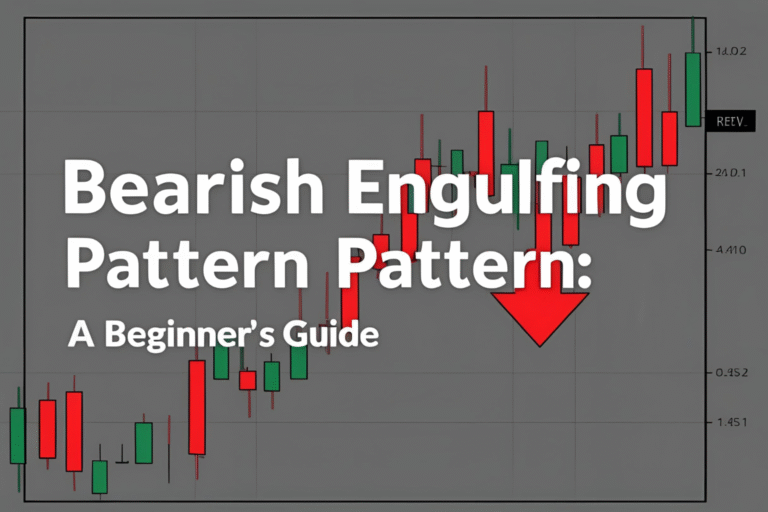
Bearish Engulfing Pattern: A Beginner’s Guide

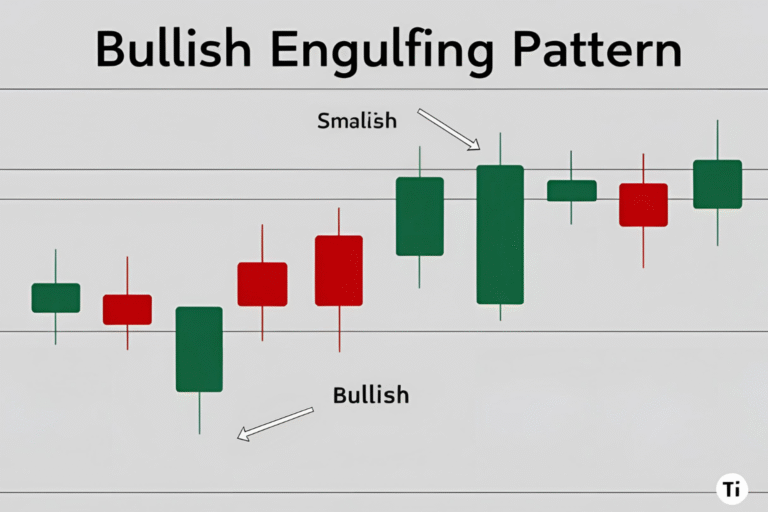
The Bearish Engulfing pattern is one of the most popular candlestick formations used to spot potential trend reversals. For beginners learning technical analysis, this pattern offers a simple yet powerful signal that sellers may be taking control of the market. In this guide, we’ll explain how the Bearish Engulfing pattern works, how to recognize it,…

Bullish Engulfing Pattern

Bullish Engulfing Pattern: How to Spot and Trade

The Bullish Engulfing pattern is a classic two-candle formation that signals a potential reversal to the upside. Whether you’re trading stocks, forex, or crypto, learning to spot this pattern can help you identify early signs of a bullish trend change. In this beginner-friendly guide, we’ll explain what the Bullish Engulfing pattern is, how to recognize…

Hanging Man Candlestick

Hanging Man Candlestick: What It Tells You

Hanging Man Candlestick: What It Tells You The Hanging Man candlestick pattern is a bearish reversal signal that appears after a price uptrend. It looks similar to the bullish hammer pattern—but its meaning is very different. For beginners, recognizing the Hanging Man at the right time can help avoid late entries and spot trend reversals…

Shooting Star Candlestick

Shooting Star Candlestick: What It Tells You

The Shooting Star candlestick is a bearish reversal pattern that warns traders of a potential trend change after a price rally. It’s one of the most visually distinct and psychologically powerful signals in candlestick charting—especially for beginners trying to recognize when the market is losing steam. In this guide, we’ll explain what the Shooting Star…

Hammer Candlestick Pattern

Hammer Candlestick Pattern: A Beginner’s Guide

The Hammer candlestick pattern is one of the most beginner-friendly and reliable bullish reversal patterns in technical analysis. Whether you’re trading stocks, forex, or crypto, spotting a Hammer at the right time can help you enter a trade just as momentum shifts upward. In this guide, you’ll learn what the Hammer pattern looks like, what…

The Doji Candlestick

The Doji Candlestick: What It Means and How to Trade It

The Doji candlestick is one of the most important patterns in technical analysis. While it looks simple, it carries deep meaning about market indecision—and can signal a powerful turning point. Whether you’re trading stocks, forex, or crypto, learning to identify and trade Doji patterns can give you an edge. In this guide, we’ll explain what…

Why Candlestick Charts Are Essential for Beginners

Why Candlestick Charts Are Essential for Beginners

If you’re new to trading, candlestick charts are one of the most important tools you should learn first. Whether you’re trading stocks, forex, or cryptocurrency, candlestick charts help you see what the market is doing—clearly and quickly. In this beginner-friendly guide, you’ll learn why candlestick charts are essential, how they work, and how they improve…

Candlestick Charts vs. Bar Charts

Candlestick Charts vs. Bar Charts: What’s the Difference?

As a beginner in trading, you might wonder about the difference between candlestick charts and bar charts. Both are used to track price movements, but they look and function differently. This guide will compare candlestick charts vs. bar charts to help you decide which is best for you. What Are Candlestick Charts? Candlestick charts show…

how to read candlestick chart

How to Read a Candlestick Chart for Beginners

Candlestick charts might look confusing at first, but they’re one of the easiest tools for beginners to understand price movements in trading. Whether you’re interested in stocks, forex, or crypto, this guide will walk you through how to read a candlestick chart step by step. Let’s break it down! What Does a Candlestick Chart Show?…

what are candlestick charts

What Are Candlestick Charts? A Beginner’s Guide

What Is a Candlestick Chart? A candlestick chart is a type of financial chart used to show price movements of assets like stocks, forex, or cryptocurrencies. Each “candlestick” represents the price action for a specific time period, such as one day, one hour, or even one minute. These charts are popular because they’re easy to…