Morning Star Pattern: A Bullish Reversal Guide
The Morning Star candlestick pattern is one of the most trusted bullish reversal signals in technical analysis. Whether you’re trading stocks, forex, or crypto, recognizing this pattern can help you enter early in a potential upward move after a downtrend.
This guide breaks down what the Morning Star pattern looks like, how it forms, and how to trade it effectively.
What Is the Morning Star Pattern?
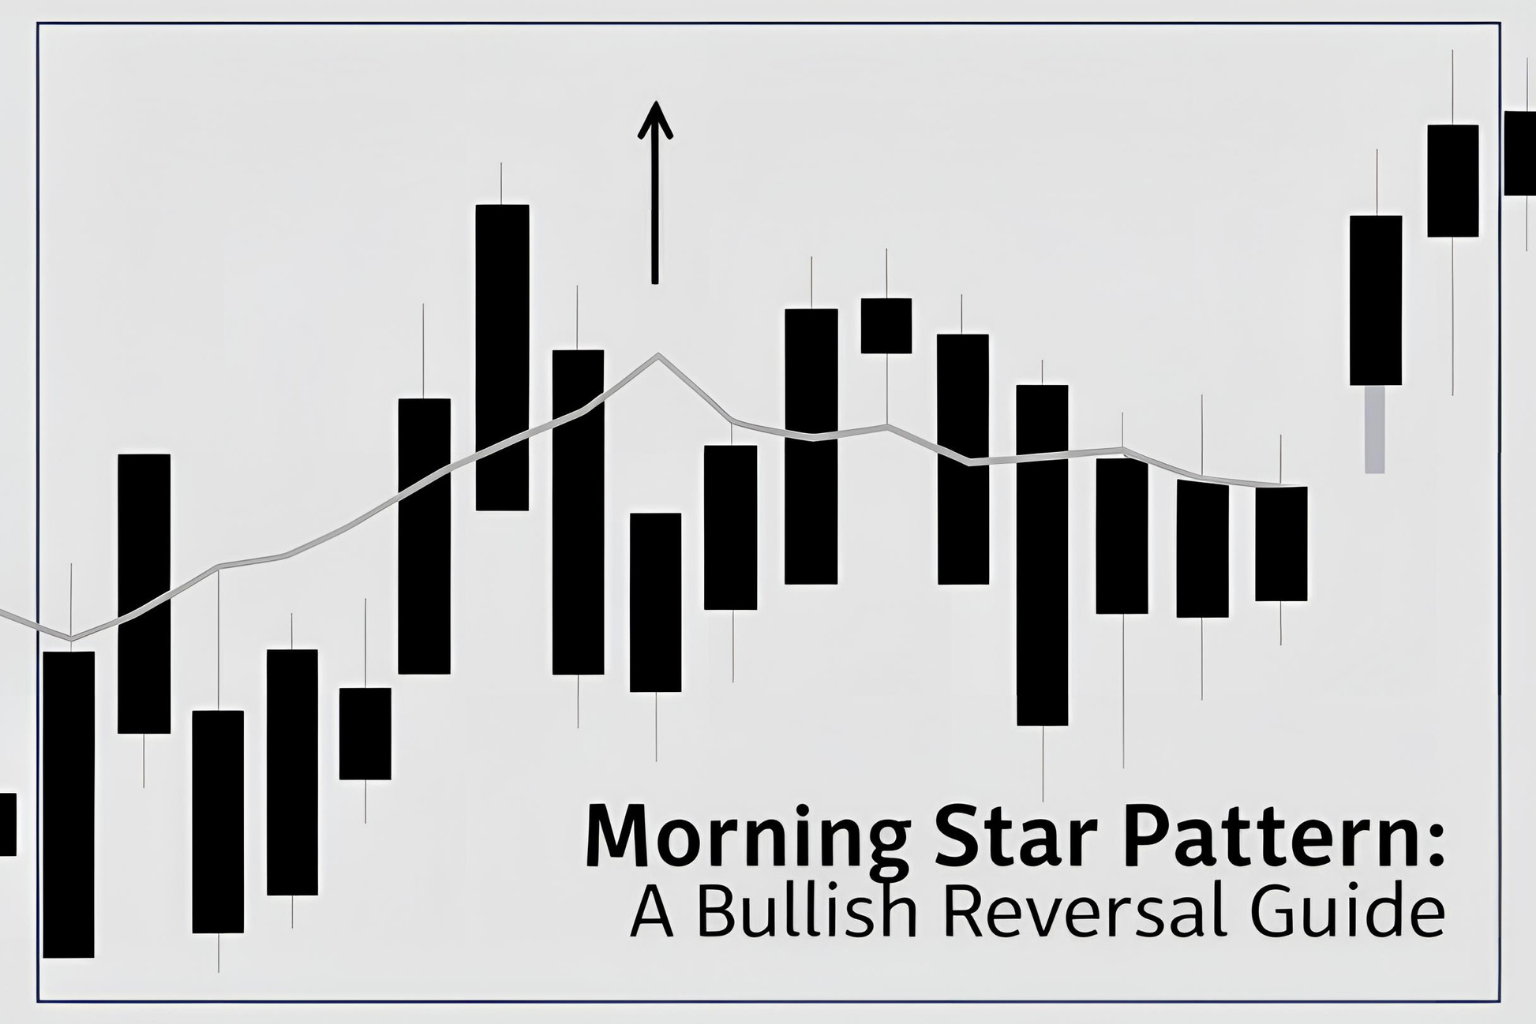
The Morning Star is a three-candle formation that signals a shift from bearish to bullish momentum. It usually forms after a sustained downtrend and represents buyer strength returning to the market.
The pattern includes:
- A large bearish candle – shows strong selling pressure
- A small-bodied candle (can be bullish, bearish, or a doji) – indicates indecision
- A large bullish candle – confirms the reversal and shift in momentum
Morning Star Candlestick Pattern Example
sqlCopyEditDay 1: Large red candle (strong downtrend)
Day 2: Small candle or doji (gap down, low volume or indecision)
Day 3: Large green candle (bullish reversal, closing near or above Day 1’s midpoint)
This structure resembles the sun rising after darkness—hence the name “Morning Star.”
How to Identify the Morning Star Pattern
Use this checklist to confirm the setup:
- Appears after a clear downtrend
- The first candle is bearish and long
- The second candle gaps down and is small (doji/spinning top)
- The third candle is bullish and closes well into the first candle’s body
- Volume increases on the third candle (optional but strengthens the signal)
Why the Morning Star Matters
This pattern helps traders:
- Spot early bullish reversals
- Enter trades with better timing
- Exit short positions before losses deepen
- Build confluence with other indicators (like RSI or support zones)
The Morning Star works well when it aligns with key technical levels like support zones, moving averages, or trendlines.
How to Trade the Morning Star Pattern
Here’s a simple strategy to follow:
1. Confirm the Pattern
Wait for all three candles to complete. Don’t enter after the second candle alone.
2. Validate With Context
Look for:
- Oversold conditions on RSI
- Price near a known support level
- Bullish divergence on MACD (optional)
3. Plan Your Entry and Exit
- Entry: At or just above the third candle’s close
- Stop-loss: Below the low of the second (or first) candle
- Take-profit: At the next resistance or based on a 1:2 risk/reward ratio
Example: Morning Star in Stock Trading
Imagine a stock is falling for several days. Suddenly, it forms:
- A long red candle
- A small doji the next day
- A strong green candle on Day 3
The third candle closes above the midpoint of the first candle. This is a classic Morning Star, especially powerful if it appears at a key support level.
FAQs
What does the Morning Star candlestick pattern mean?
It signals a potential bullish reversal after a downtrend, showing that buyers are regaining control.
Is the Morning Star pattern reliable?
Yes—especially on higher timeframes like the 4-hour, daily, or weekly charts and when supported by volume or indicators.
Can the Morning Star form in crypto and forex?
Absolutely. This pattern works in all markets, including stocks, forex, and cryptocurrencies.
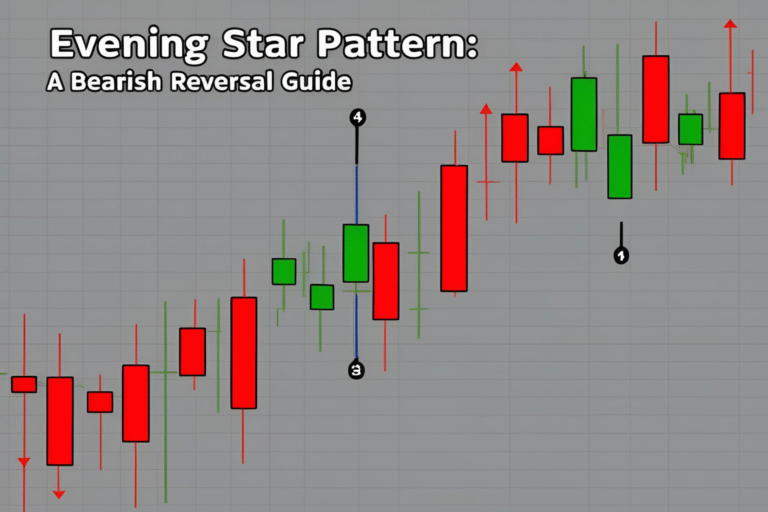
How is the Morning Star different from the Evening Star?
- Morning Star: Appears at the bottom of a trend (bullish)
- Evening Star: Appears at the top of a trend (bearish)
What is the best timeframe for spotting the Morning Star?
The daily and 4-hour charts offer more reliable signals for beginners.