candlestick charts forex

How to Use Candlestick Charts in Forex Trading

Candlestick charts are one of the most popular tools used by forex traders to analyze price movements and predict market direction. For beginners, understanding how to use candlestick charts in forex trading can significantly improve your ability to make informed trading decisions. In this guide, you’ll learn how candlestick charts work in forex, which patterns…

candlestick charts stocks

Candlestick Charts for Stock Trading: A Beginner’s Guide

If you’re just getting started in stock trading, candlestick charts are one of the most powerful tools you can learn. They provide a clear, visual way to understand price action and help you make better entry and exit decisions. This guide will walk you through the basics of candlestick charts and how to use them…

candlestick patterns support resistance

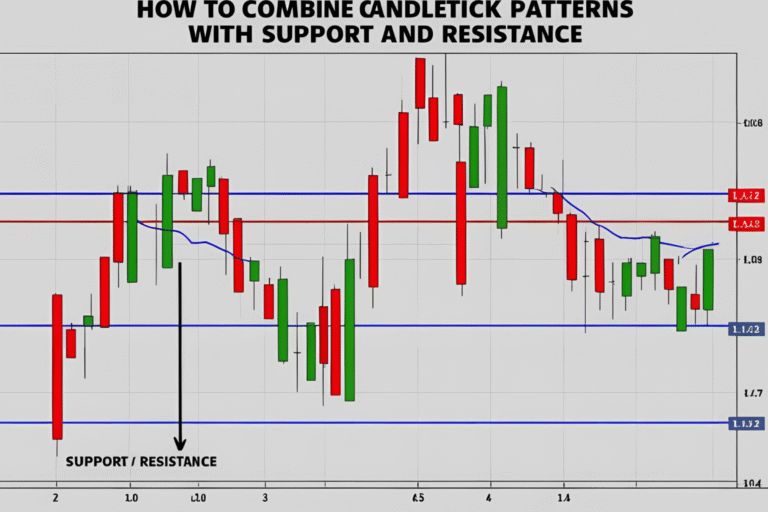
How to Combine Candlestick Patterns with Support and Resistance

Candlestick patterns are powerful tools for identifying potential market turning points. When combined with support and resistance levels, they become even more reliable. This beginner-friendly guide shows you how to use candlestick patterns alongside key price zones to improve your trading decisions. What Are Support and Resistance? Before combining these concepts, let’s define them: These…

candlestick charts crypto

Candlestick Charts in Crypto Trading: A Beginner’s Guide

The cryptocurrency market is known for its speed and volatility—but with the right tools, you can navigate it confidently. One of the most effective tools for beginners is the candlestick chart. These charts help you understand market psychology, spot trends, and make better entry and exit decisions in crypto trading. In this guide, you’ll learn…