how to read candlestick chart

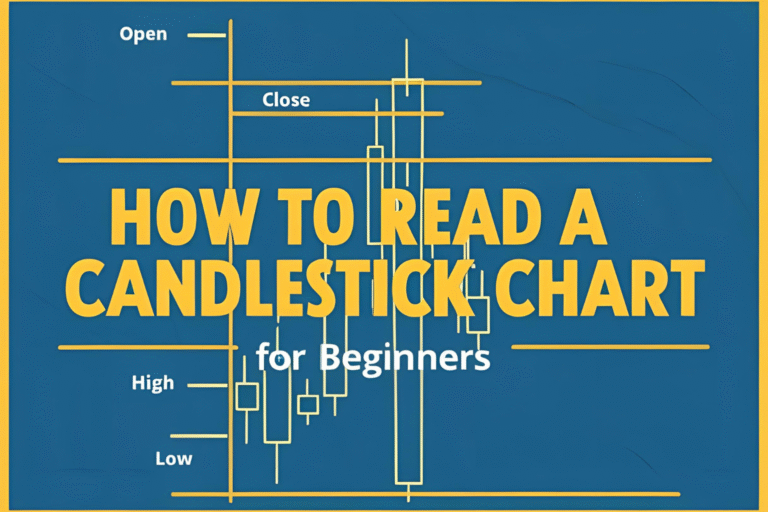
How to Read a Candlestick Chart for Beginners

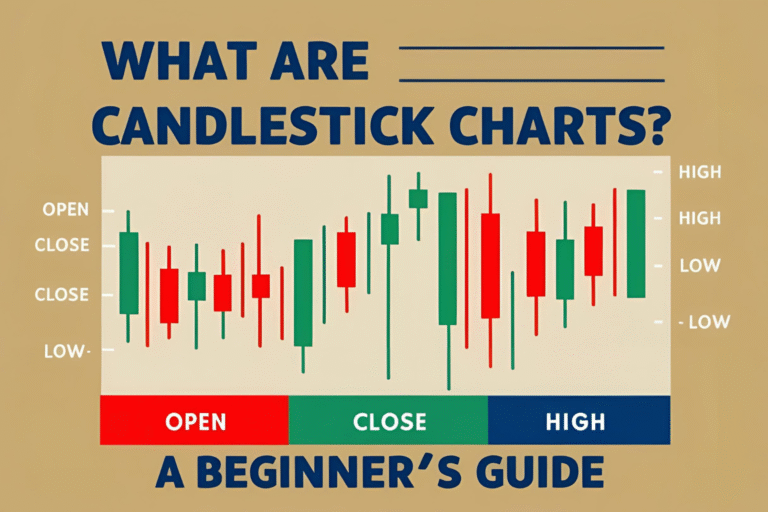
Candlestick charts might look confusing at first, but they’re one of the easiest tools for beginners to understand price movements in trading. Whether you’re interested in stocks, forex, or crypto, this guide will walk you through how to read a candlestick chart step by step. Let’s break it down! What Does a Candlestick Chart Show?…

Candlestick Charts vs. Bar Charts

Candlestick Charts vs. Bar Charts: What’s the Difference?

As a beginner in trading, you might wonder about the difference between candlestick charts and bar charts. Both are used to track price movements, but they look and function differently. This guide will compare candlestick charts vs. bar charts to help you decide which is best for you. What Are Candlestick Charts? Candlestick charts show…

Why Candlestick Charts Are Essential for Beginners

Why Candlestick Charts Are Essential for Beginners

If you’re new to trading, candlestick charts are one of the most important tools you should learn first. Whether you’re trading stocks, forex, or cryptocurrency, candlestick charts help you see what the market is doing—clearly and quickly. In this beginner-friendly guide, you’ll learn why candlestick charts are essential, how they work, and how they improve…

what are candlestick charts

What Are Candlestick Charts? A Beginner’s Guide

What Is a Candlestick Chart? A candlestick chart is a type of financial chart used to show price movements of assets like stocks, forex, or cryptocurrencies. Each “candlestick” represents the price action for a specific time period, such as one day, one hour, or even one minute. These charts are popular because they’re easy to…