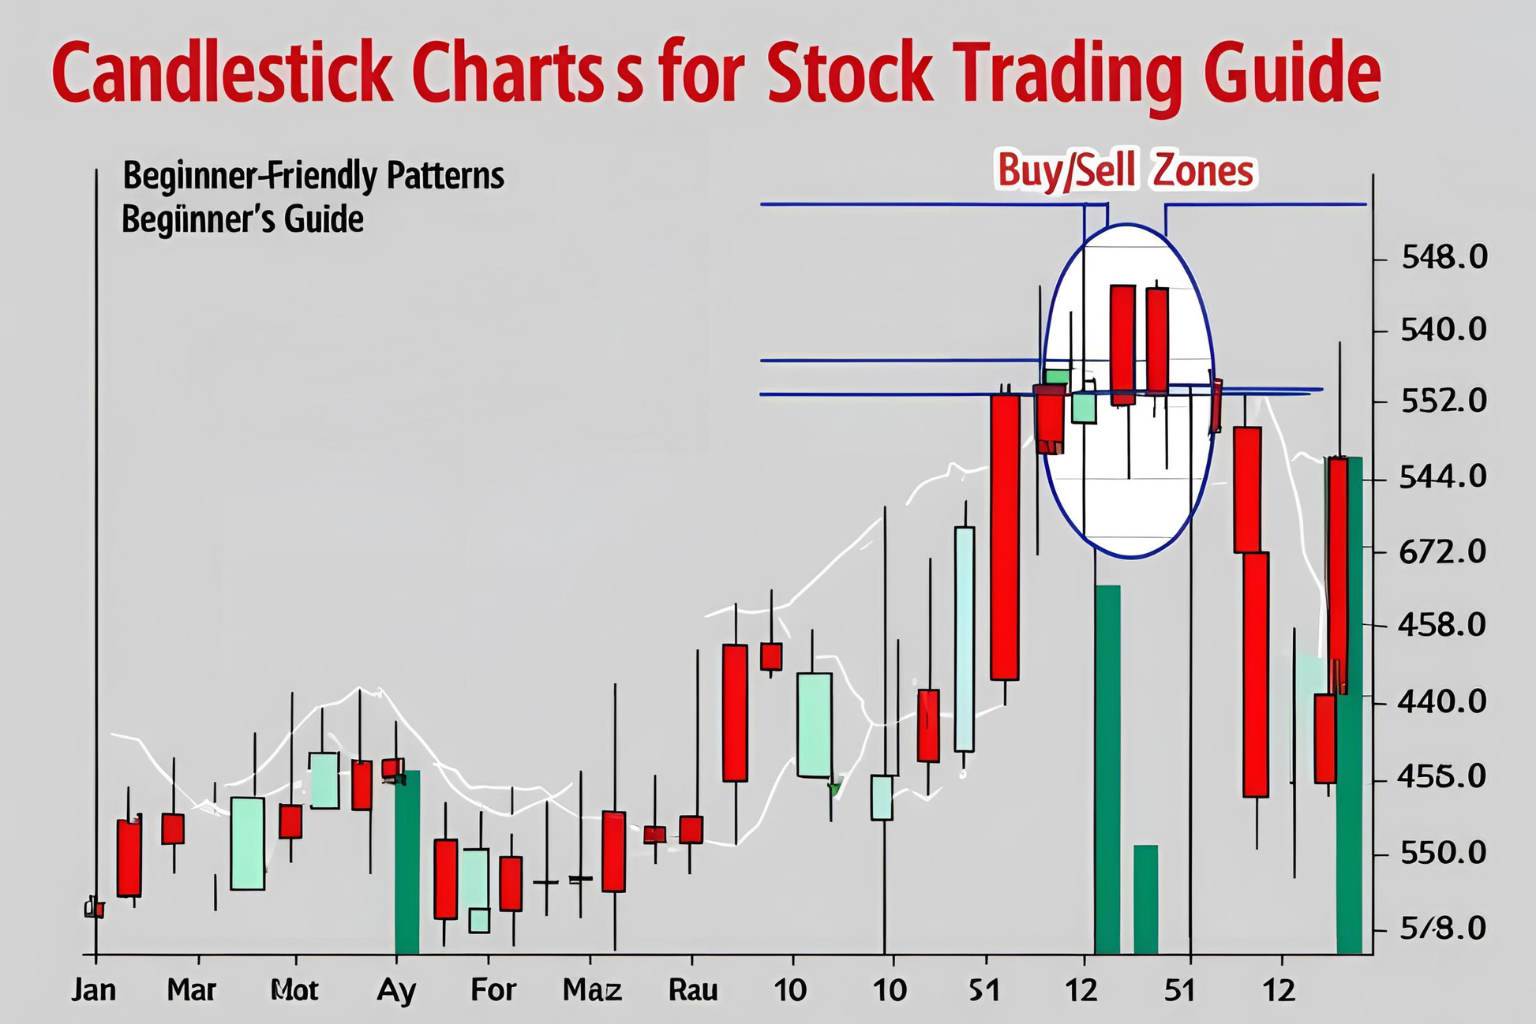
Candlestick Charts for Stock Trading: A Beginner’s Guide
If you’re just getting started in stock trading, candlestick charts are one of the most powerful tools you can learn. They provide a clear, visual way to understand price action and help you make better entry and exit decisions. This guide will walk you through the basics of candlestick charts and how to use them in stock trading.
What Are Candlestick Charts?
Candlestick charts show the price movement of a stock over a specific time period—whether it’s one minute, one hour, one day, or more. Each candle displays four key pieces of information:
- Open price
- Close price
- High price
- Low price
Candles are typically color-coded:
- Green or white: Price closed higher than it opened (bullish)
- Red or black: Price closed lower than it opened (bearish)
Why Use Candlestick Charts in Stock Trading?
Candlestick charts help traders:
- Spot trends and reversals
- Identify buying and selling pressure
- Recognize common patterns for trade setups
Compared to line or bar charts, candlestick charts offer a more detailed and intuitive view of market sentiment.
How to Read Candlestick Charts for Stocks
Each candlestick has:
- A body (between open and close)
- Wicks or shadows (lines extending to high and low)
A long body means strong price movement, while long wicks may signal rejection or volatility.
Example:
- A long bullish candle may indicate strong buying interest.
- A doji (very small body) signals indecision in the market.
Popular Candlestick Patterns for Stocks
Here are a few simple and effective patterns beginners can start with:
1. Doji
- Signals market indecision
- May indicate a potential reversal
2. Hammer
- Appears after a downtrend
- Suggests a possible bullish reversal
3. Bullish Engulfing
- Strong reversal signal where a green candle fully covers the previous red one
4. Shooting Star
- Appears after an uptrend
- Indicates bearish reversal pressure
5. Morning Star
- Three-candle bullish reversal pattern
These patterns work well on daily and weekly charts, where signals tend to be more reliable.
Best Timeframes for Stock Traders
- 1-minute to 15-minute: Day trading and scalping
- 1-hour to 4-hour: Intraday or swing trading
- Daily to weekly: Position trading and long-term investing
Beginners usually start with daily charts for clearer signals and less market noise.
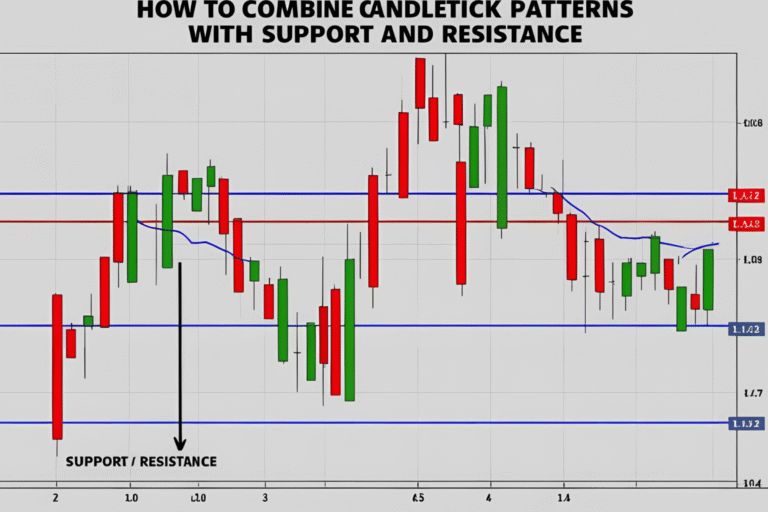
How to Use Candlestick Charts in a Trading Strategy
- Identify the overall trend using moving averages or trendlines
- Look for candlestick patterns near support or resistance levels
- Wait for confirmation – e.g., a pattern plus volume or a breakout
- Set your entry, stop-loss, and take-profit levels
- Manage your risk – Use position sizing and risk-reward ratios
Example: Trading a Bullish Engulfing Pattern
Let’s say you’re watching a stock that’s been declining, but it forms a bullish engulfing pattern near a support zone.
- Entry: After the green candle closes
- Stop-loss: Below the low of the pattern
- Target: Nearest resistance or prior high
FAQs
Are candlestick charts good for beginners in stock trading?
Yes. Candlestick charts are easy to understand and offer visual clues about market direction.
What is the best timeframe for candlestick trading in stocks?
The daily chart is the most beginner-friendly, but intraday traders may prefer 15-minute to 1-hour charts.
Can I trade stocks using only candlestick patterns?
Yes, but it’s best to combine patterns with support/resistance and risk management strategies.
What platform shows candlestick charts for stocks?
Most brokers and platforms (e.g., TradingView, ThinkorSwim, Zerodha, Webull) offer candlestick charts.
Do candlestick patterns work for all stocks?
They work best with liquid, actively traded stocks where price action is more meaningful.