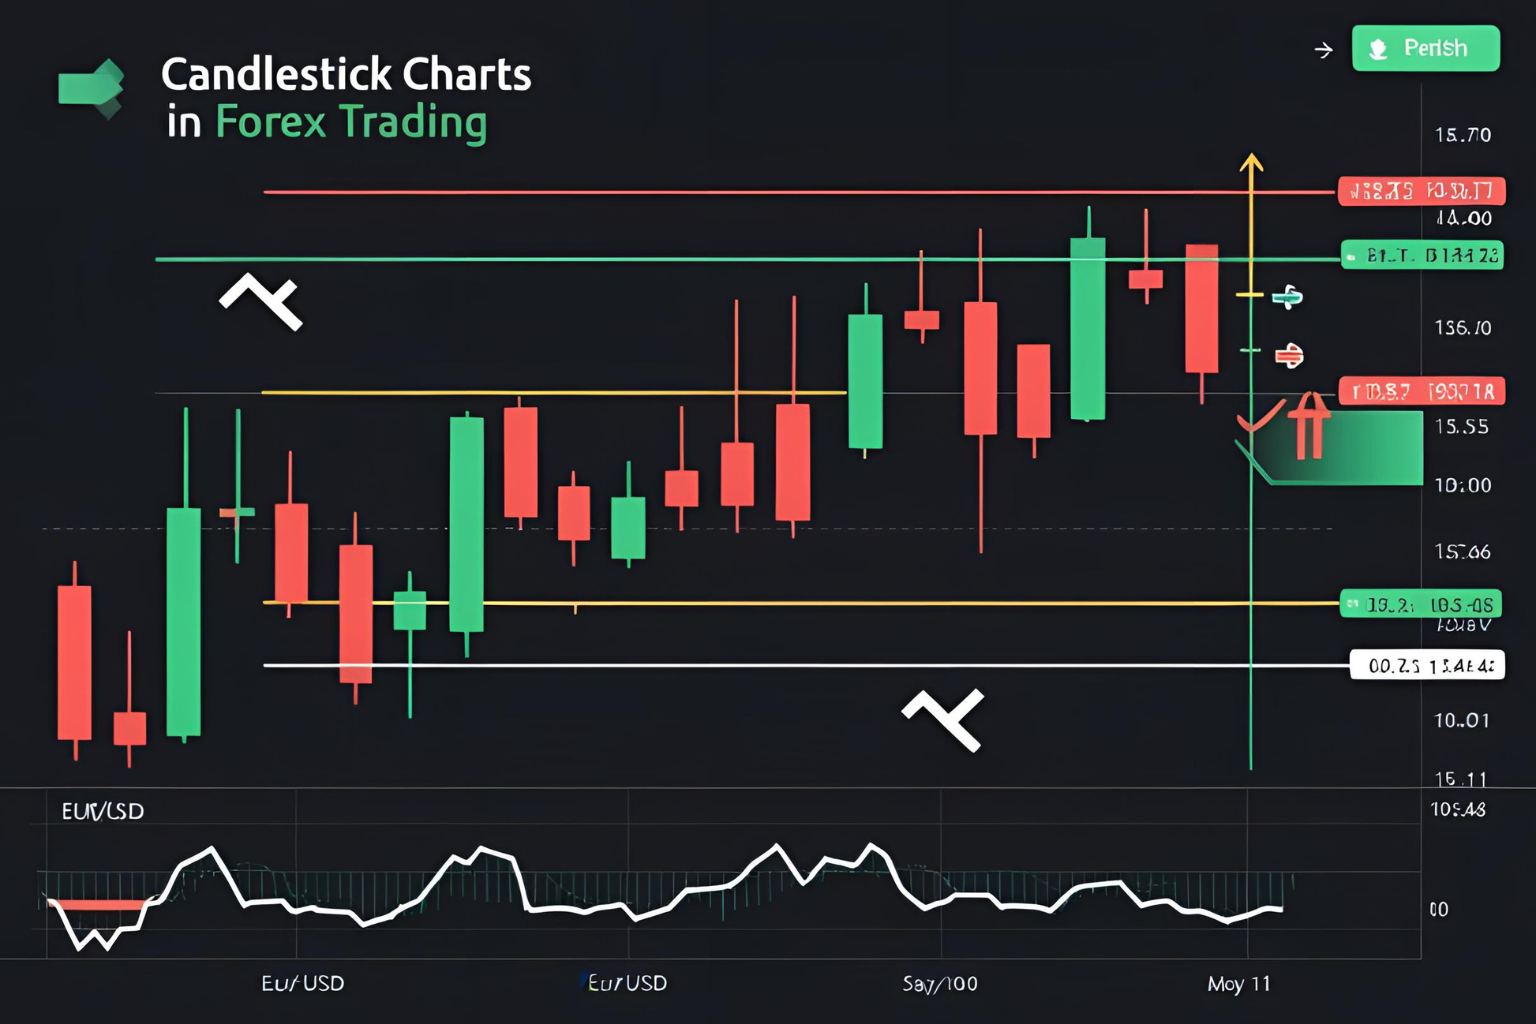
How to Use Candlestick Charts in Forex Trading
Candlestick charts are one of the most popular tools used by forex traders to analyze price movements and predict market direction. For beginners, understanding how to use candlestick charts in forex trading can significantly improve your ability to make informed trading decisions.
In this guide, you’ll learn how candlestick charts work in forex, which patterns to watch, and how to use them in real trades.
Why Candlestick Charts Are Ideal for Forex Trading
Forex markets operate 24 hours a day, five days a week, with constant price movements. Candlestick charts offer a visual and intuitive way to read these price actions, showing:
- Opening price
- Closing price
- High and low during a timeframe
Each candle gives you insight into market sentiment, helping you identify whether buyers or sellers are in control.
Key Benefits of Candlestick Charts in Forex
- Visual clarity: Easier to spot reversals and trends than line or bar charts
- Pattern-based signals: Offers trade entries based on historical price behavior
- Applicable to any timeframe: Works on 1-minute, 1-hour, 4-hour, or daily charts
How to Read Candlestick Charts in Forex
Each candlestick tells a story about price action:
- Bullish candle (usually green or white): Close is higher than open
- Bearish candle (usually red or black): Close is lower than open
- Wicks (shadows): Indicate highs and lows reached during the timeframe
Understanding the candle’s body and wick size gives clues about volatility, strength of the move, and potential exhaustion.
Best Timeframes to Use Candlesticks in Forex
- 1-minute to 15-minute: Best for scalping and high-frequency trades
- 1-hour to 4-hour: Common among swing and intraday traders
- Daily charts: Ideal for position traders and long-term strategies
Beginners often start with the 4-hour or daily chart to reduce noise and focus on clearer signals.
Candlestick Patterns to Watch in Forex
Here are some beginner-friendly patterns with strong relevance in forex markets:
1. Doji – Signals indecision; common before trend reversals
2. Engulfing Pattern – Strong reversal signal (bullish or bearish)
3. Hammer / Inverted Hammer – Bullish signal after a downtrend
4. Shooting Star – Bearish signal after an uptrend
5. Morning Star / Evening Star – Reliable trend reversal indicators
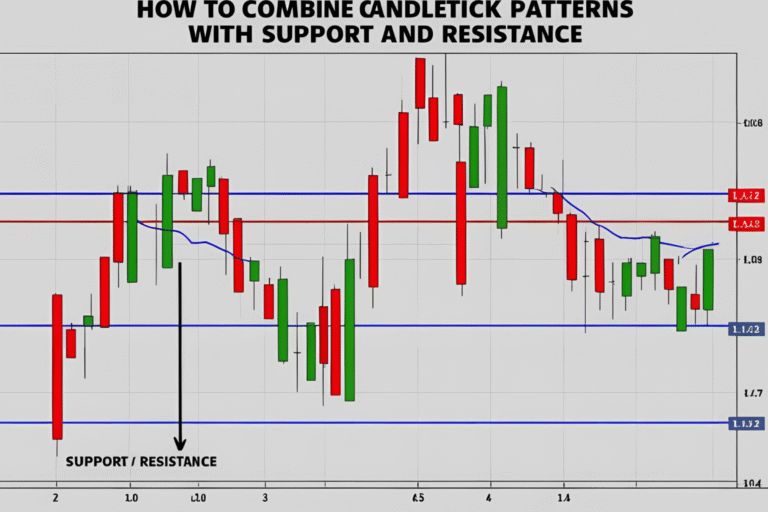
Always confirm these patterns with market context, like support/resistance or trendlines.
How to Trade Forex Using Candlestick Patterns
Follow this simple approach:
- Identify the trend – Use trendlines or moving averages
- Look for patterns – Find candlestick formations near key price levels
- Confirm the setup – Check with indicators (e.g., RSI or MACD) or volume
- Plan your trade – Define entry, stop-loss (usually beyond wick), and take-profit levels
- Use risk management – Never risk more than 1-2% of your account on one trade
Real Example: Bullish Engulfing on EUR/USD
Let’s say EUR/USD is in a short-term downtrend. You spot a bullish engulfing pattern forming on the 4-hour chart at a support level. This could signal a potential bounce.
- Entry: After the bullish candle closes
- Stop-loss: Below the pattern’s low
- Take-profit: Near next resistance zone
This simple strategy combines candlestick analysis with strong forex principles.
FAQs
Are candlestick charts reliable in forex?
Yes. Candlestick patterns have proven reliability, especially when combined with other tools like trendlines or support and resistance.
What’s the best candlestick pattern for forex?
The engulfing and pin bar (hammer/shooting star) patterns are among the most effective in forex.
Do forex brokers support candlestick charts?
Almost all major platforms (like MetaTrader 4/5, TradingView, and cTrader) support candlestick charts.
Can beginners use candlestick charts?
Absolutely. Candlestick charts are often easier for beginners to understand compared to traditional line or bar charts.
Which timeframe is best for candlestick patterns in forex?
The 4-hour and daily timeframes tend to be more reliable due to reduced market noise.


