Candlestick Charts in Crypto Trading: A Beginner’s Guide
The cryptocurrency market is known for its speed and volatility—but with the right tools, you can navigate it confidently. One of the most effective tools for beginners is the candlestick chart. These charts help you understand market psychology, spot trends, and make better entry and exit decisions in crypto trading.
In this guide, you’ll learn how candlestick charts work in crypto, why they matter, and which patterns to watch.
Why Use Candlestick Charts in Crypto?
Unlike traditional markets, crypto trades 24/7 without breaks. Candlestick charts are ideal for this fast-moving environment because they:
- Visualize price action in real-time
- Reveal patterns that indicate potential reversals or continuations
- Adapt to any timeframe (1-minute to monthly)
Candlestick charts show you what traders are doing, not just where the price is.
How to Read a Candlestick in Crypto
Each candlestick represents a specific time period and includes:
- Open price
- Close price
- High price
- Low price
A green candle (bullish) means the close is higher than the open.
A red candle (bearish) means the close is lower than the open.
The “wicks” or “shadows” show how high or low the price moved during that time.
Best Timeframes for Crypto Traders
- 1-minute to 15-minute: Used for scalping or high-frequency trades
- 1-hour to 4-hour: Best for short-term swing trading
- Daily charts: Ideal for spotting larger trends and long-term positions
Beginners should focus on 4-hour and daily charts to reduce noise and avoid impulsive trades.
Key Candlestick Patterns for Crypto Traders
Here are some beginner-friendly patterns that work well in crypto markets:
1. Bullish Engulfing
- Strong reversal signal during a downtrend
2. Hammer
- Suggests a bounce off support in a downtrend
3. Shooting Star
- Signals bearish reversal after a price rally
4. Doji
- Indicates indecision, often a prelude to a breakout
5. Morning Star / Evening Star
- Three-candle patterns signaling bullish or bearish reversals
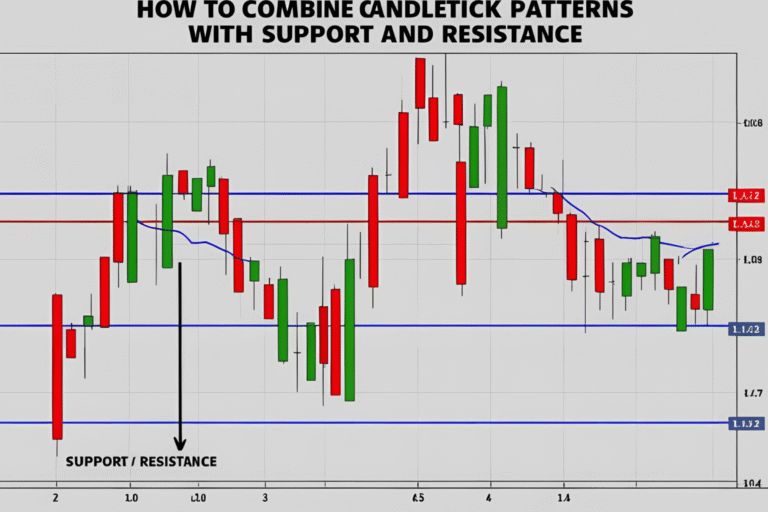
These patterns are especially useful when they appear near support or resistance levels.
Real Example: BTC/USD Bullish Engulfing on Daily Chart
Bitcoin (BTC/USD) is in a downtrend and approaches a historical support level. A bullish engulfing pattern forms on the daily chart, signaling strong buyer interest.
- Entry: After the bullish candle closes
- Stop-loss: Below the low of the pattern
- Take-profit: At the next resistance or using a 1:2 risk/reward ratio
This setup is common across major crypto pairs like BTC/USD, ETH/USD, and SOL/USD.
Trading Tips for Beginners Using Candlestick Charts
- Don’t trade patterns in isolation: Always check trend direction and context
- Use support/resistance zones for added confirmation
- Stick to higher timeframes (4H and above) for cleaner signals
- Practice on a demo account before risking real capital
Platforms like TradingView, Binance, and Coinbase Advanced offer free candlestick charting tools.
FAQs
Are candlestick charts effective in crypto?
Yes. They help traders visualize sentiment and identify opportunities in real time.
Which is the best timeframe for candlestick trading in crypto?
The 4-hour and daily timeframes are best for beginners to avoid noise and false signals.
Do candlestick patterns work for altcoins?
Yes. They work across all liquid crypto assets including BTC, ETH, SOL, XRP, and more.
What’s the most reliable candlestick pattern in crypto?
The engulfing pattern and hammer are two of the most reliable, especially near key levels.
Can I use candlestick charts on mobile apps?
Yes. Most crypto trading apps and platforms support mobile-friendly candlestick charts.