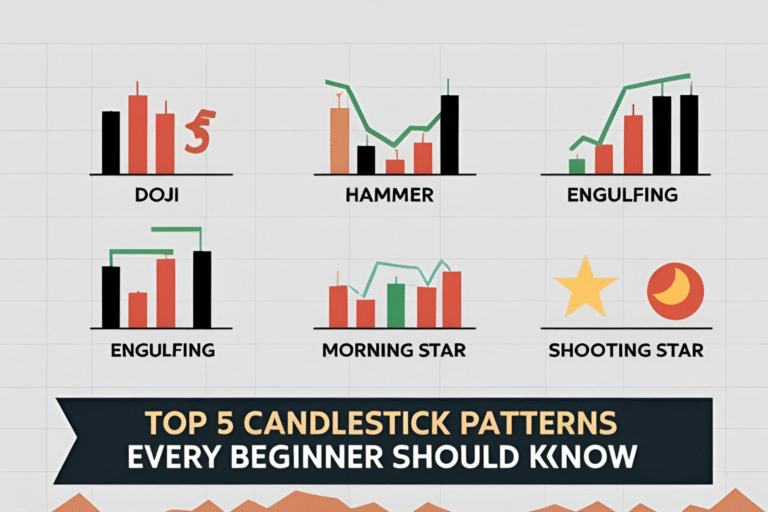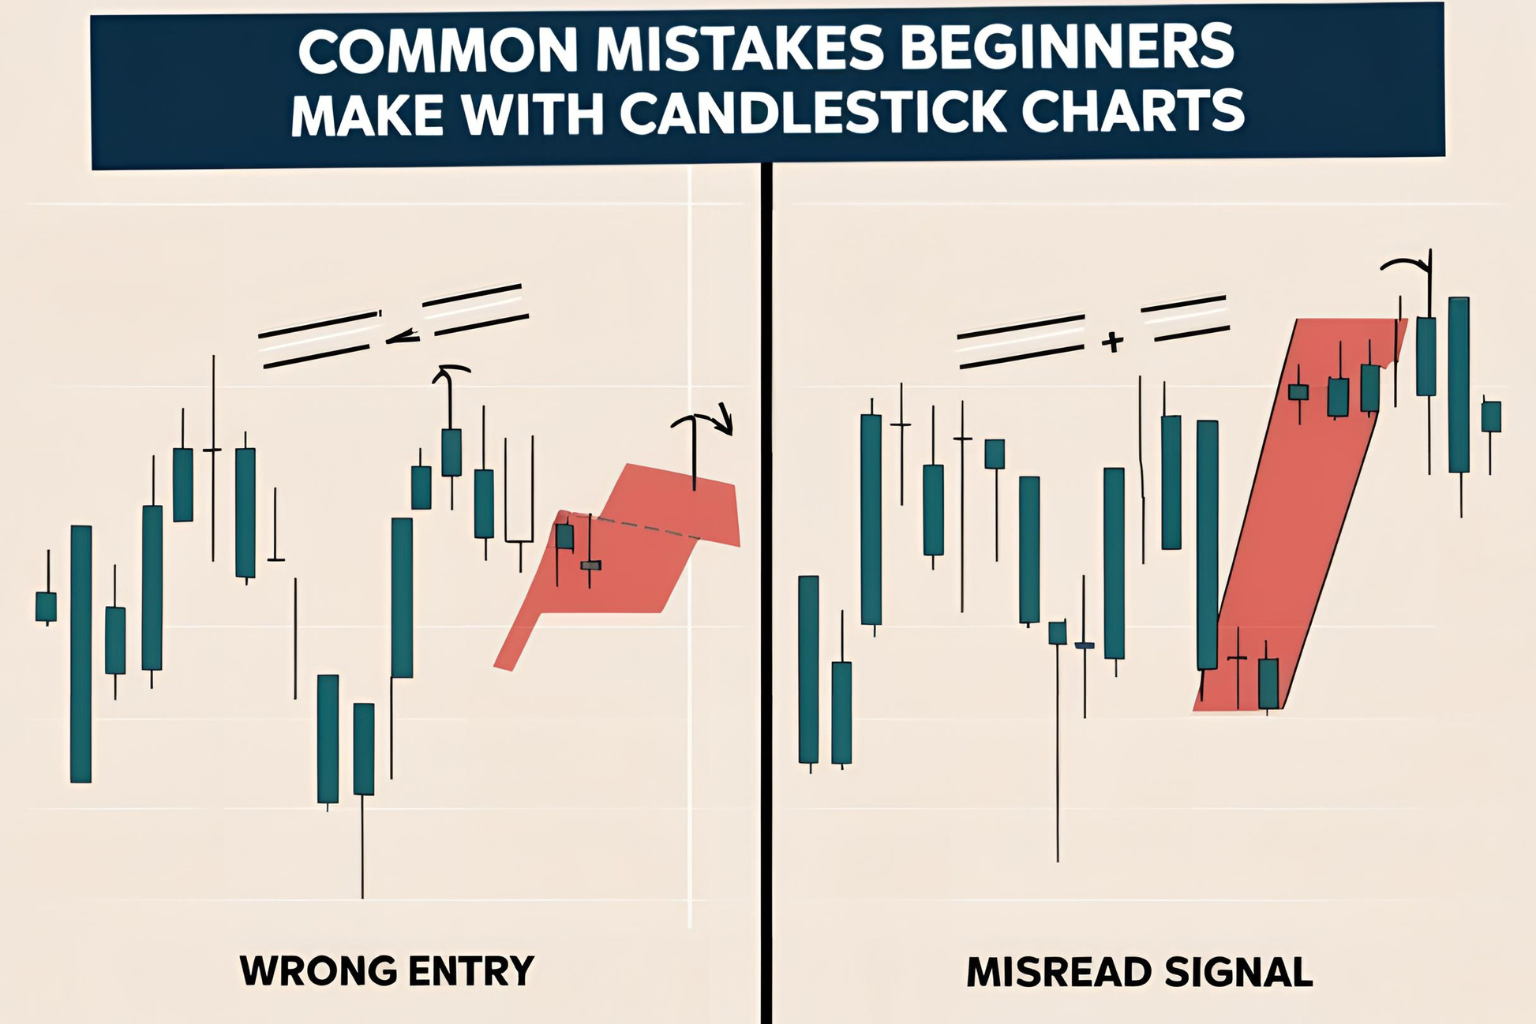
Common Mistakes Beginners Make with Candlestick Charts
Candlestick charts are a powerful visual tool in technical analysis, but they’re often misunderstood or misused—especially by new traders. While the patterns may look simple, using them effectively takes knowledge and practice. In this guide, we’ll cover the most common mistakes beginners make with candlestick charts and how to avoid them.
1. Relying on Patterns Without Context
One of the biggest mistakes beginners make is trading candlestick patterns in isolation. A bullish engulfing or a doji can’t be trusted unless it appears in the right market context.
What to do instead:
- Always look at the overall trend
- Check if the pattern is forming near support or resistance
- Use indicators like RSI or MACD for confirmation
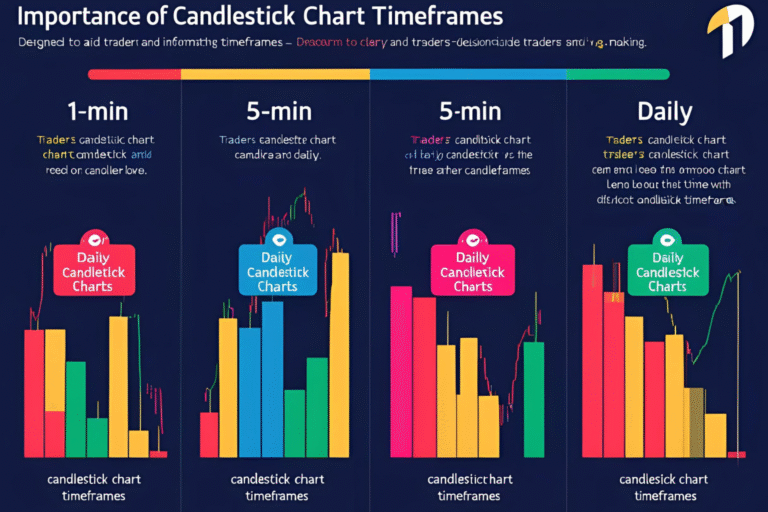
2. Ignoring Timeframes
Patterns can appear very frequently on short timeframes (1-min, 5-min), but they’re often unreliable due to market noise.
What to do instead:
- Stick to higher timeframes like the 1-hour, 4-hour, or daily charts
- Use lower timeframes only for fine-tuning entries after confirmation
3. Forcing Patterns That Aren’t There
Some traders see patterns everywhere—even when they’re not valid. This is called pattern hunting and often leads to false signals.
What to do instead:
- Use a checklist for pattern criteria (e.g., for a hammer: small body + long lower wick)
- Don’t trade unless the pattern clearly meets all characteristics
4. Entering Before the Candle Closes
Jumping into a trade before a pattern completes is risky. The market may reverse by the time the candle closes, making your entry invalid.
What to do instead:
- Wait for the pattern to fully form and close
- Confirm the signal with the next candle or a secondary indicator
5. Using Candlestick Patterns as Standalone Strategies
Candlestick charts are a great starting point, but they should be part of a larger strategy that includes:
- Risk management
- Entry and exit rules
- Position sizing
What to do instead:
- Build a full trading plan that includes candlestick patterns as one of several tools
- Never risk more than 1–2% of your capital on a single trade
6. Ignoring Volume
Candlestick patterns without volume analysis can give incomplete signals. Volume confirms whether the buying or selling pressure is strong enough to support the pattern.
What to do instead:
- Use volume to validate breakouts and reversals
- Look for increased volume on confirmation candles
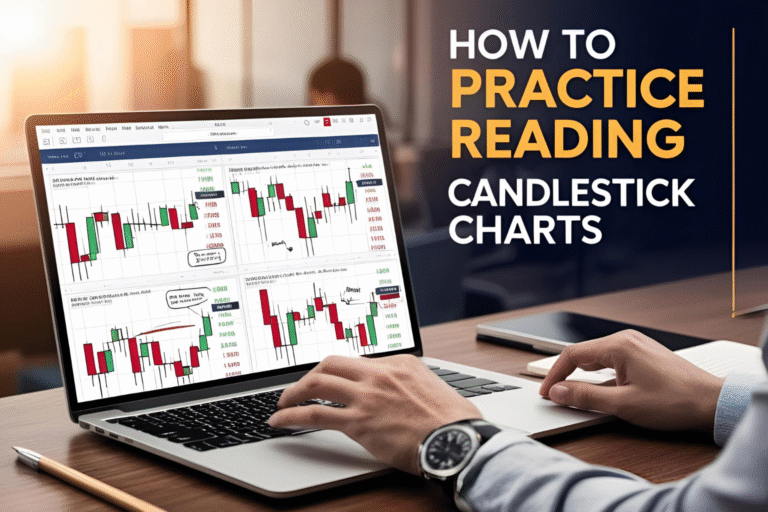
7. Not Practicing Enough
Beginners often rush into live trading without building pattern recognition skills.
What to do instead:
- Use demo accounts to practice spotting patterns
- Analyze historical charts on platforms like TradingView
- Journal your trades and review what worked and what didn’t
FAQs
Are candlestick patterns always accurate?
No. They improve accuracy when combined with other tools like trendlines, support/resistance, and indicators.
Can I use candlestick patterns alone for trading?
You can, but it’s not recommended. Confirmation and a full trading strategy are key.
What’s the safest timeframe for beginners?
The 4-hour and daily charts provide cleaner signals and reduce false patterns caused by market noise.
How can I get better at reading candlestick charts?
Practice regularly, use a journal, and review real trade examples. Learning from mistakes is essential.
Do candlestick patterns work in all markets?
Yes. They work across stocks, forex, and crypto, especially in liquid markets with strong price action.