Bullish Engulfing Pattern: How to Spot and Trade
The Bullish Engulfing pattern is a classic two-candle formation that signals a potential reversal to the upside. Whether you’re trading stocks, forex, or crypto, learning to spot this pattern can help you identify early signs of a bullish trend change.
In this beginner-friendly guide, we’ll explain what the Bullish Engulfing pattern is, how to recognize it, and how to trade it effectively.
What Is a Bullish Engulfing Pattern?
A Bullish Engulfing is a two-candle bullish reversal pattern that forms after a downtrend. It reflects a shift in momentum from sellers to buyers.
Key Features:
- The first candle is bearish (red or black)
- The second candle is bullish (green or white) and completely engulfs the body of the first candle
- Appears after a declining market or at a support level
This pattern shows that buyers have taken control, and a potential upward move may follow.
How to Identify a Bullish Engulfing Pattern
Use this simple checklist:
- The market is in a downtrend or has recently pulled back
- The first candle is bearish with a small body
- The second candle is bullish and fully engulfs the body (not necessarily the wicks) of the first candle
- Volume increase on the second candle strengthens the signal
- Ideally forms near support zones, trendlines, or oversold conditions
What the Bullish Engulfing Pattern Tells You
- Sellers controlled the market initially
- Buyers entered strongly on the second day
- The strong bullish candle suggests renewed buying interest
- Often marks the beginning of a bullish reversal or bounce
This makes it a great tool for identifying entry points early in a trend shift.
How to Trade the Bullish Engulfing Pattern
Step-by-step guide:
- Confirm the Pattern
- Wait for both candles to form completely
- Look for Support or Oversold Conditions
- Stronger when appearing near a support level, moving average, or RSI < 30
- Wait for Confirmation
- The next candle should ideally close bullish to confirm upward momentum
- Plan the Trade
- Entry: Just above the second candle’s high
- Stop-loss: Below the low of the second candle
- Take-profit: At the next resistance level or with a 1:2 risk/reward ratio
Example: Bullish Engulfing on a Crypto Chart
Let’s say Ethereum (ETH/USD) has been dropping and approaches a known support level. On the 4-hour chart, a small bearish candle is followed by a large green candle that completely engulfs the first.
- Entry: Above the green candle’s high
- Stop-loss: Below the engulfing candle’s low
- Target: Next resistance or recent swing high
This setup is commonly seen across stocks, forex, and crypto markets.
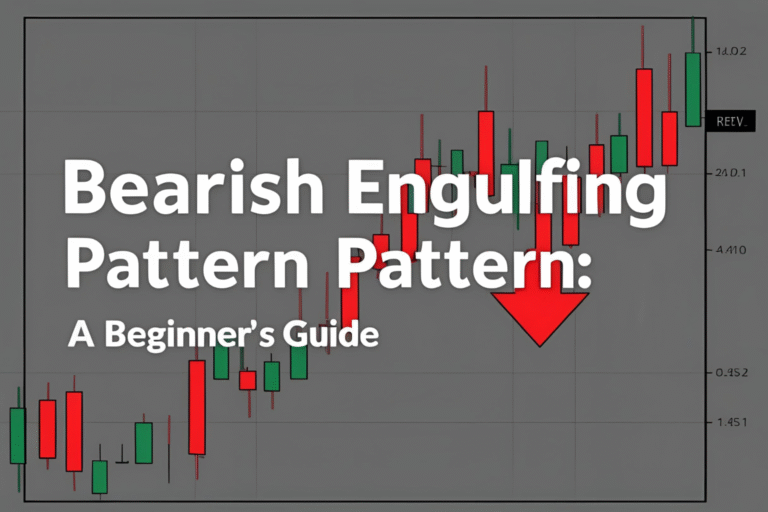
Bullish Engulfing vs Bearish Engulfing
| Pattern | Appears After | Signal Type |
|---|---|---|
| Bullish Engulfing | Downtrend | Bullish Reversal |
| Bearish Engulfing | Uptrend | Bearish Reversal |
Common Mistakes to Avoid
- Entering too early: Always wait for the candle to fully form
- Ignoring the trend: Only trade it after a clear downtrend
- Skipping confirmation: Look for follow-through buying
- Trading without context: Combine with support zones or RSI for better accuracy
FAQs
What does the Bullish Engulfing pattern mean?
It signals a potential reversal to the upside, where buyers regain control after a downtrend.
Is the Bullish Engulfing pattern reliable?
Yes—especially on higher timeframes (4-hour, daily) and when combined with support or volume confirmation.
Does this pattern work in all markets?
Yes. It works in stocks, forex, crypto, and even commodities—anywhere price action is tracked.
Should I trade the pattern without confirmation?
It’s best to wait for confirmation, such as a bullish close or volume increase, before entering.
What timeframe works best?
The 4-hour and daily charts provide clearer and more reliable Bullish Engulfing signals for beginners.