Bearish Engulfing Pattern: A Beginner’s Guide
The Bearish Engulfing pattern is one of the most popular candlestick formations used to spot potential trend reversals. For beginners learning technical analysis, this pattern offers a simple yet powerful signal that sellers may be taking control of the market.
In this guide, we’ll explain how the Bearish Engulfing pattern works, how to recognize it, and how to trade it with confidence.
What Is a Bearish Engulfing Pattern?
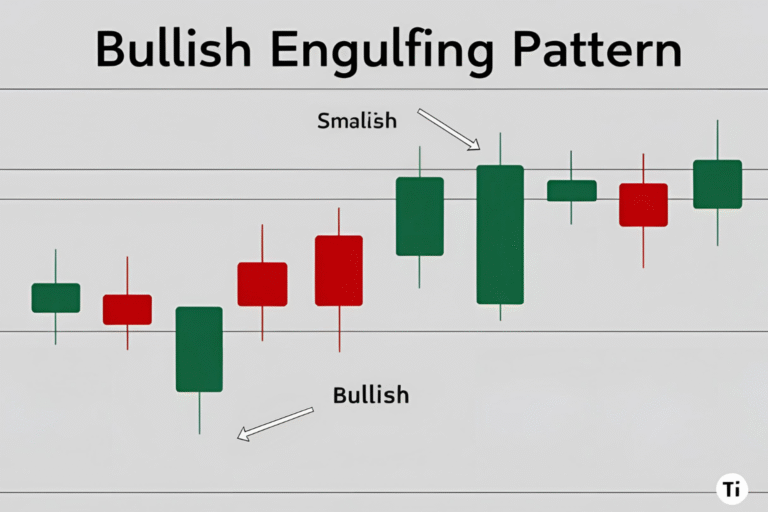
The Bearish Engulfing is a two-candle pattern that signals a potential reversal to the downside after an uptrend. It shows that buyers have lost momentum and sellers are gaining control.
Key features:
- The first candle is bullish (typically green or white)
- The second candle is bearish (typically red or black) and completely engulfs the body of the first candle
- It appears after a price advance or uptrend
This shift in control suggests that a trend reversal or pullback may be coming.
How to Identify a Bearish Engulfing Pattern
To confirm the pattern, check for the following:
- The market is in an uptrend or recent rally
- The first candle has a small real body
- The second candle opens higher (or close to the previous close) but closes below the open of the first candle
- The body of the second candle completely wraps around the first candle’s body
Optional strength signals:
- High trading volume on the second candle
- Occurs near resistance or overbought levels
Why the Bearish Engulfing Pattern Matters
This pattern reflects a sudden shift in sentiment:
- Buyers dominate early but fail to hold gains
- Sellers enter strongly and erase previous gains
- Momentum often shifts in favor of bears
It’s especially powerful when confirmed by other technical tools like RSI divergence, MACD crossovers, or trendline breaks.
How to Trade the Bearish Engulfing Pattern
Here’s a simple step-by-step approach for beginners:
1. Identify the Setup
Look for the pattern after an uptrend, especially near resistance or after a strong rally.
2. Confirm the Pattern
Wait for the second candle to fully close. Never act before the pattern is complete.
3. Enter the Trade
- Entry: Just below the second candle’s low
- Stop-loss: Above the high of the pattern
- Take-profit: At the next support level or using a 1:2 or 1:3 risk-reward ratio
Real-World Example: Forex Trading
In the EUR/USD 4-hour chart, price rallies into a resistance zone. A Bearish Engulfing pattern forms:
- The first candle is small and bullish
- The second is large and bearish, engulfing the previous body
- RSI is also showing overbought conditions
This combination offers a strong short entry opportunity.
Common Mistakes to Avoid
- Trading in isolation: Always confirm with context (trend, support/resistance)
- Ignoring volume: High volume adds credibility to the signal
- Forcing the pattern: Make sure the second candle fully engulfs the first
- Skipping stop-loss: Always manage your risk
FAQs
What does the Bearish Engulfing pattern indicate?
It signals a potential bearish reversal after an uptrend, indicating sellers are taking over.
Is this pattern reliable?
Yes, especially on higher timeframes (like daily or 4-hour charts) and near key resistance levels.
Can I use this pattern in crypto trading?
Absolutely. It works in stocks, forex, and crypto, as long as the market is trending.
How is it different from the Bullish Engulfing pattern?
Bearish Engulfing signals a reversal down, while Bullish Engulfing indicates a reversal up after a downtrend.
What is the best confirmation tool to use?
Look for volume spikes, resistance zones, or confirmation from RSI/MACD indicators.