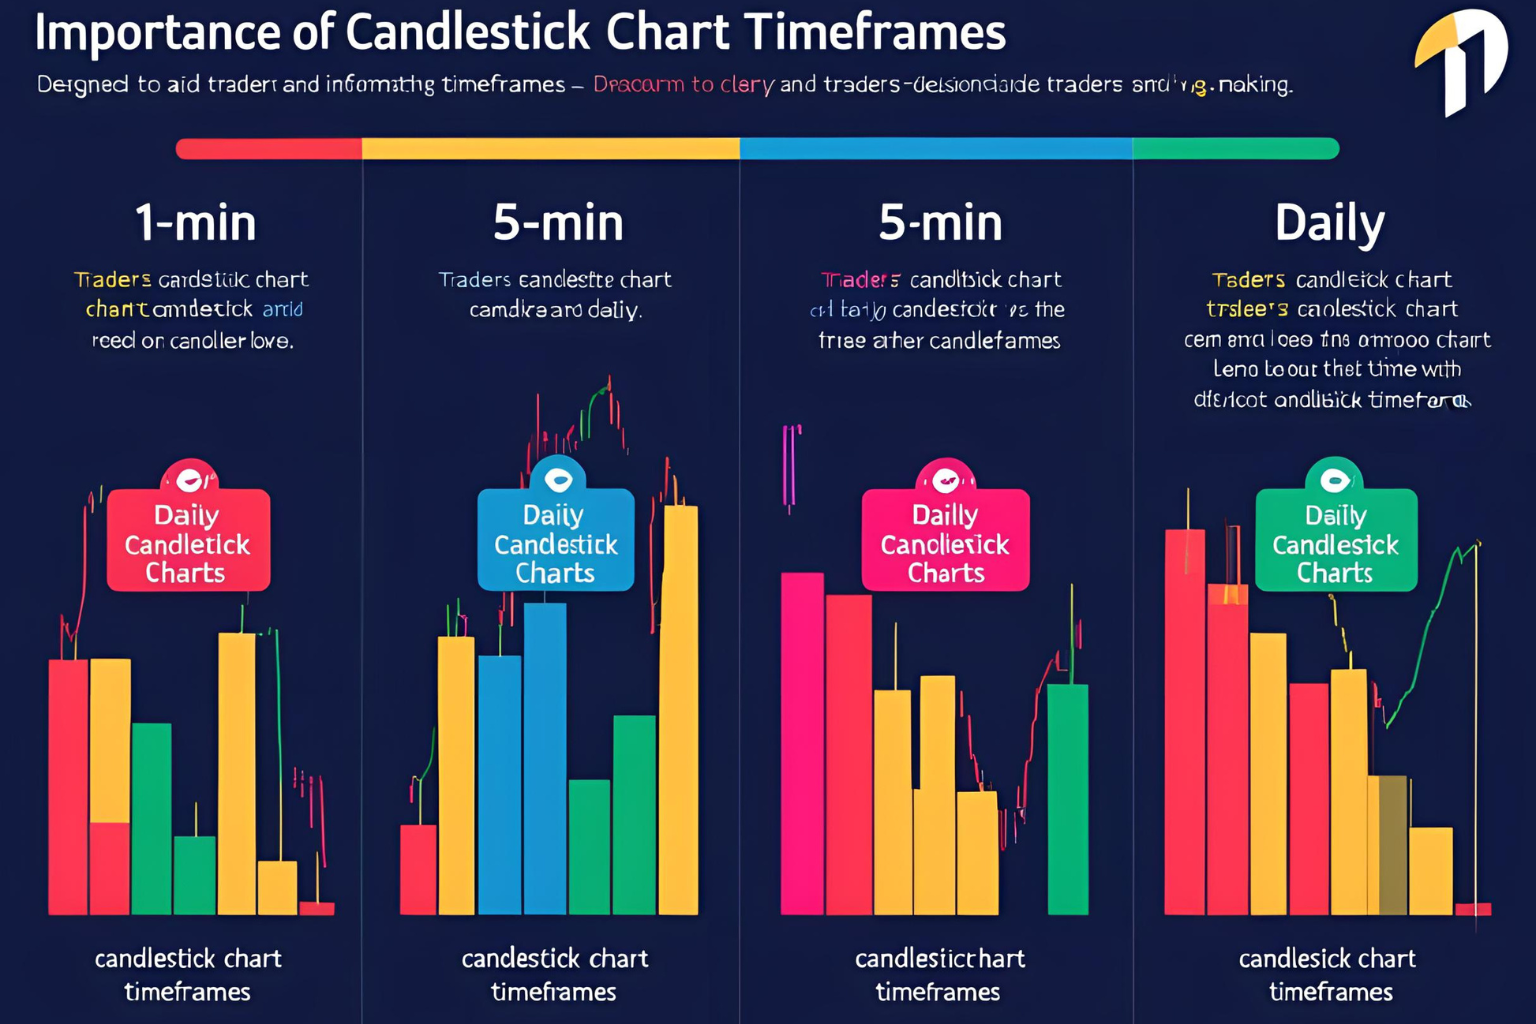
The Importance of Candlestick Chart Timeframes
Understanding candlestick charts is essential for beginners in trading, but just as important is knowing which timeframe you’re analyzing. Timeframes affect how you interpret price action, identify patterns, and make trading decisions. Whether you’re trading stocks, forex, or crypto, choosing the right timeframe can make or break your strategy.
What Is a Candlestick Chart Timeframe?
A candlestick chart timeframe refers to the amount of time each candlestick represents. For example:
- On a 1-minute chart, each candle shows price movement over one minute.
- On a daily chart, each candle summarizes one full trading day.
This choice of timeframe determines how detailed or broad your view of the market will be.
Common Timeframes Used in Trading
Beginners often get overwhelmed by the many options available, but most traders stick to a few key timeframes:
1-Minute to 15-Minute Charts (Intraday)
- Best for: Scalpers and day traders
- Pros: Real-time decision making
- Cons: Highly sensitive to noise; can lead to overtrading
1-Hour to 4-Hour Charts (Short-Term)
- Best for: Active traders and swing traders
- Pros: Balanced view of price action
- Cons: May miss long-term trends
Daily Charts (Medium-Term)
- Best for: Position traders
- Pros: Captures full trading sessions; less noise
- Cons: Slower signals
Weekly and Monthly Charts (Long-Term)
- Best for: Long-term investors
- Pros: Big-picture trends
- Cons: Delayed signals and fewer trading opportunities
Why Timeframes Matter in Candlestick Analysis
Timeframes influence:
- Pattern reliability – A bullish engulfing pattern on a daily chart holds more weight than on a 1-minute chart.
- Signal frequency – Shorter timeframes show more setups, but many are false.
- Risk and reward – Short timeframes mean tighter stop-losses but smaller profit potential.
How to Choose the Right Timeframe
If you’re just getting started, follow this simple rule:
“Match your timeframe to your lifestyle and goals.”
- If you can monitor charts all day: use 5-min or 15-min charts.
- If you check once a day: go for daily charts.
- If you prefer long-term investing: weekly charts are ideal.
Can You Use Multiple Timeframes?
Yes! This is called multi-timeframe analysis. For example:
- Use a daily chart to understand the trend.
- Use a 1-hour chart to time your entry.
This combination gives you context and precision.
Example: Timeframes in Action
Imagine a stock shows a bullish engulfing pattern on the 15-minute chart, but the daily chart shows a downtrend. That short-term bullish signal might not be reliable. Always check higher timeframes to confirm patterns.
FAQs
What is the best candlestick chart timeframe for beginners?
For most beginners, the daily timeframe offers a good balance between clarity and simplicity.
Can I trade using only one timeframe?
Yes, but using multiple timeframes can provide better context and reduce false signals.
Why do candlestick patterns look different on each timeframe?
Because each candle represents a different period. A doji on a 1-minute chart might be part of a larger bullish candle on a daily chart.
Do timeframes matter in crypto trading too?
Absolutely. Timeframes work the same across all markets, including crypto, forex, and stocks.
What is the most reliable timeframe for candlestick analysis?
The daily and 4-hour charts are considered the most reliable by many traders due to lower noise.