Candlestick Charts vs. Bar Charts: What’s the Difference?
As a beginner in trading, you might wonder about the difference between candlestick charts and bar charts. Both are used to track price movements, but they look and function differently. This guide will compare candlestick charts vs. bar charts to help you decide which is best for you.
What Are Candlestick Charts?
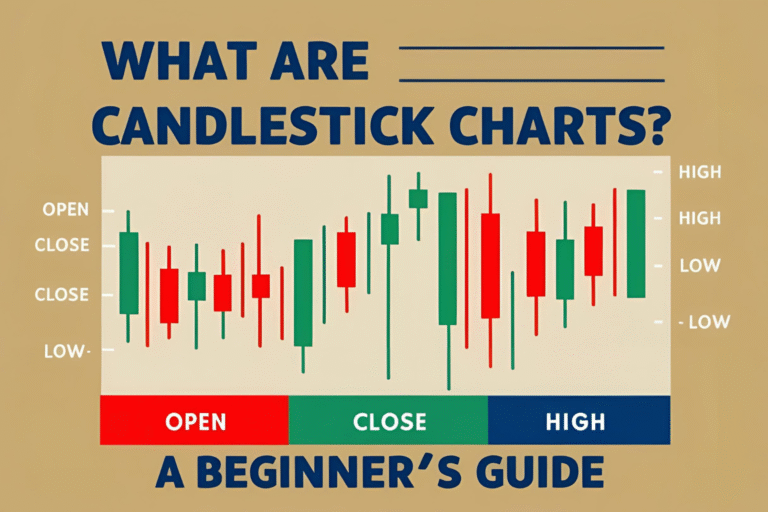
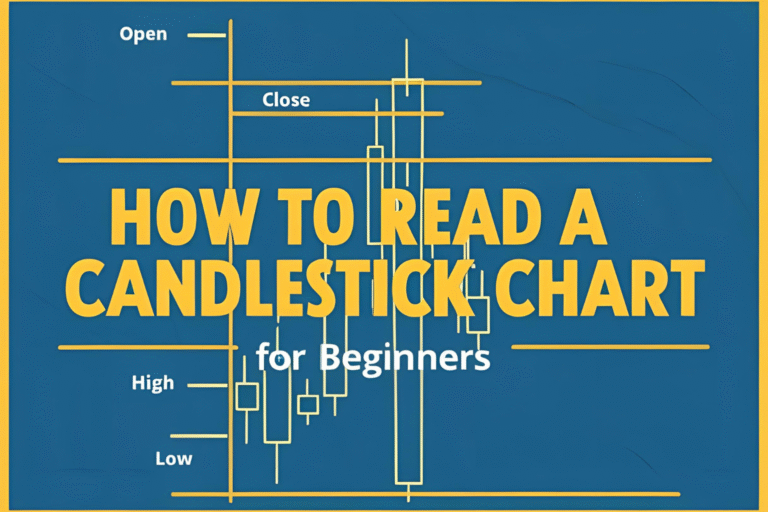
Candlestick charts show price movements for a specific time period using “candlesticks.” Each candlestick displays:
- Open price
- Close price
- High price
- Low price
The body (thick part) shows the open-to-close range, and wicks (thin lines) show the high and low. Green candlesticks indicate a price increase, while red shows a decrease.
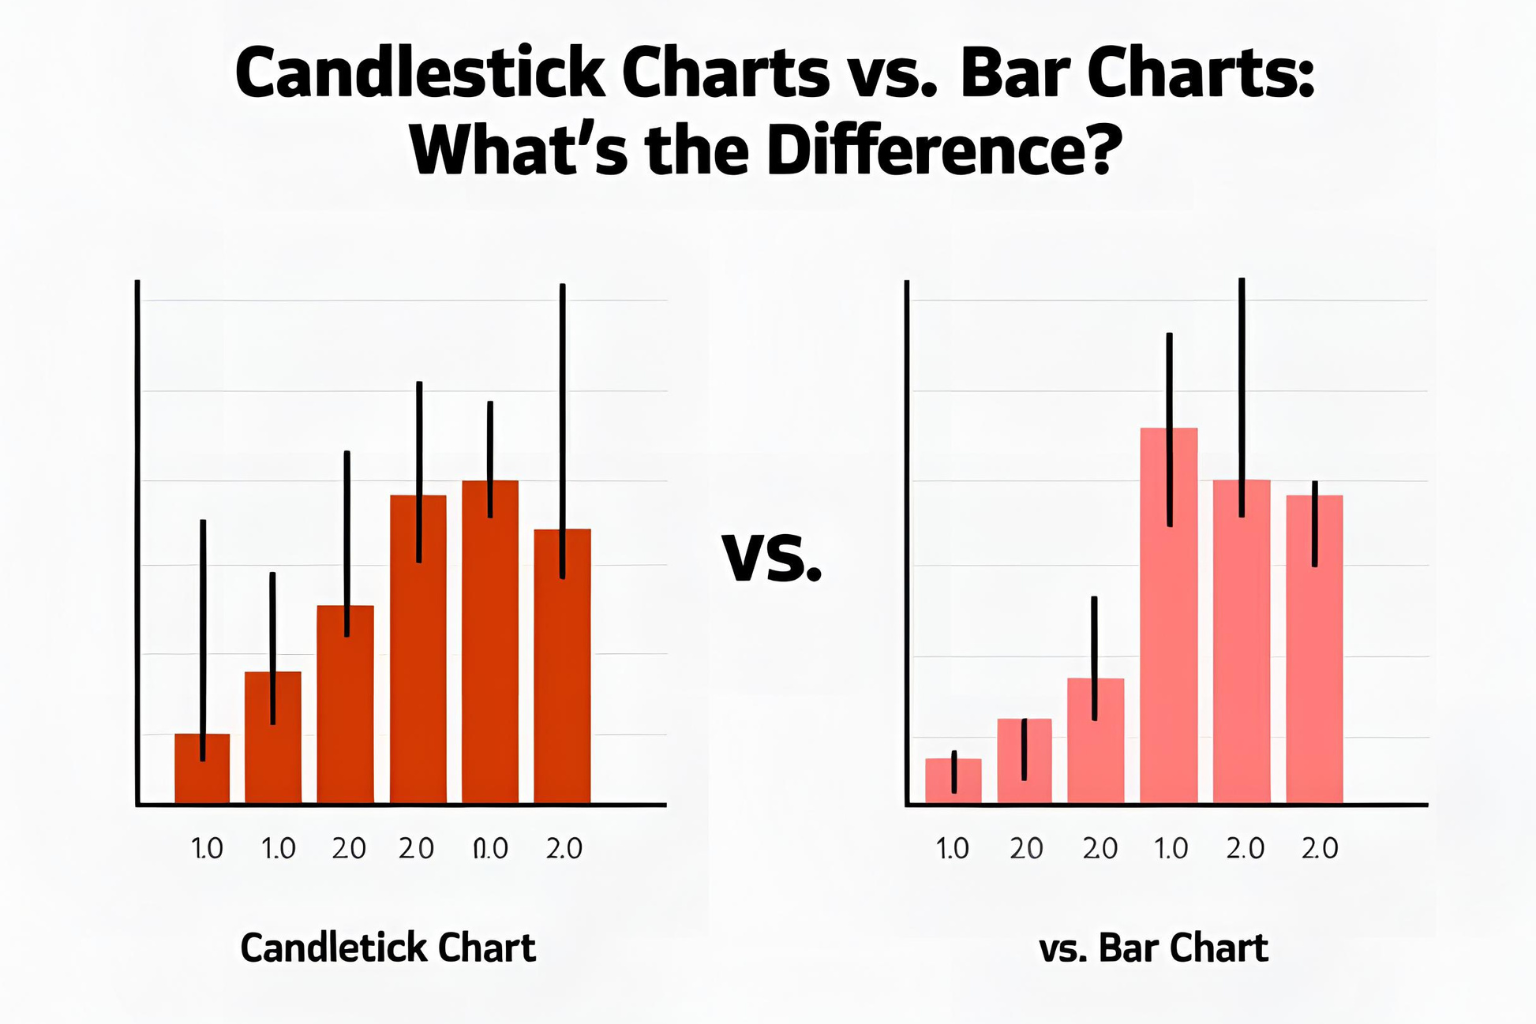
What Are Bar Charts?
Bar charts also show price movements but use vertical bars. Each bar represents a time period and includes:
- A horizontal tick on the left for the open price.
- A horizontal tick on the right for the close price.
- The top of the bar for the high price.
- The bottom of the bar for the low price.
Unlike candlesticks, bar charts don’t use color to show price direction, which can make them harder to read.
Key Differences Between Candlestick and Bar Charts
Here’s a quick comparison:
| Feature | Candlestick Chart | Bar Chart |
|---|---|---|
| Visual Style | Colored bodies and wicks | Plain bars with ticks |
| Ease of Reading | Beginner-friendly, color-coded | Less intuitive, no colors |
| Pattern Recognition | Clear patterns (e.g., doji) | Patterns less obvious |
| Popularity | Widely used in trading | Common in older systems |
Learn more about candlestick patterns in Top 5 Candlestick Patterns for Beginners.
Which Is Better for Beginners?
Candlestick charts are generally better for beginners because:
- Color Coding: Green and red make it easy to spot price direction.
- Patterns: Candlestick patterns (like hammer or engulfing) are easier to identify.
- Popularity: Most trading platforms and tutorials focus on candlesticks.
Bar charts might be useful if you’re using an older platform or prefer a minimalist look, but they’re less intuitive for new traders.
When to Use Each Chart
- Candlestick Charts: Ideal for stocks, forex, or crypto trading, especially if you’re learning patterns or using modern platforms like TradingView.
- Bar Charts: Suitable for specific markets or platforms that don’t support candlesticks, but less common today.
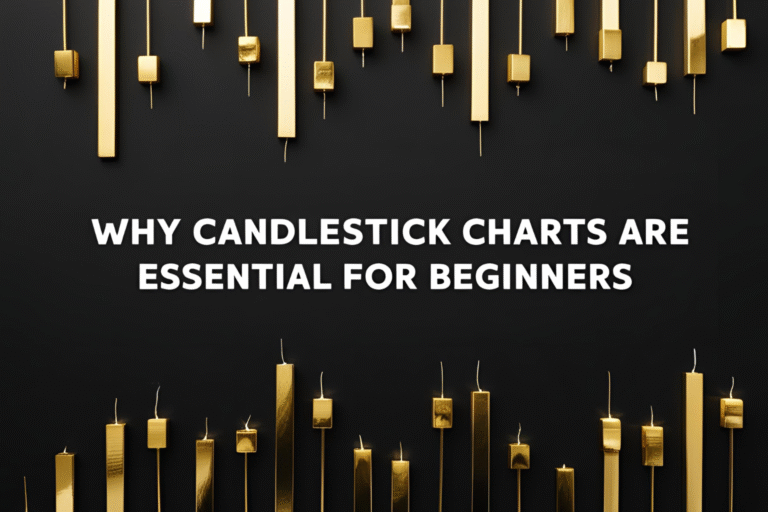
Why Candlestick Charts Win for Beginners
Candlestick charts are easier to read and more visually engaging, making them perfect for beginners. They help you quickly understand market trends and spot trading opportunities.
Ready to dive into candlesticks? Read How to Read a Candlestick Chart for Beginners.